Performance by product type
APRA’s product performance lookup tools enable users to access and compare product-specific information on investment returns, fees, and performance test metrics. APRA has also published lists of significant underperformers by product category.
The lookup tools and lists of significantly underperforming products can be accessed by product category below:
- MySuper: Default superannuation products with single, diversified investment strategies.
- Non-platform trustee directed products: Standalone diversified investment offerings where the trustee or a connected entity of the trustee has control over the management of investments and/or sets the strategic asset allocations of the product offering.
- Platform trustee directed products: Diversified investment offerings that form part of a larger investment structure where members can create bespoke portfolios. The trustee or a connected entity of the trustee has control over the management of investments and/or sets the strategic asset allocations of these product offerings.
- Non-platform externally directed products: Standalone diversified investment offerings where the trustee or a connected entity of the trustee has no control over the management of investments and/or sets the strategic asset allocations of the product offering.
APRA’s comprehensive product performance package forms part of APRA’s broader efforts to increase transparency in superannuation across performance, expenditure, and investment.
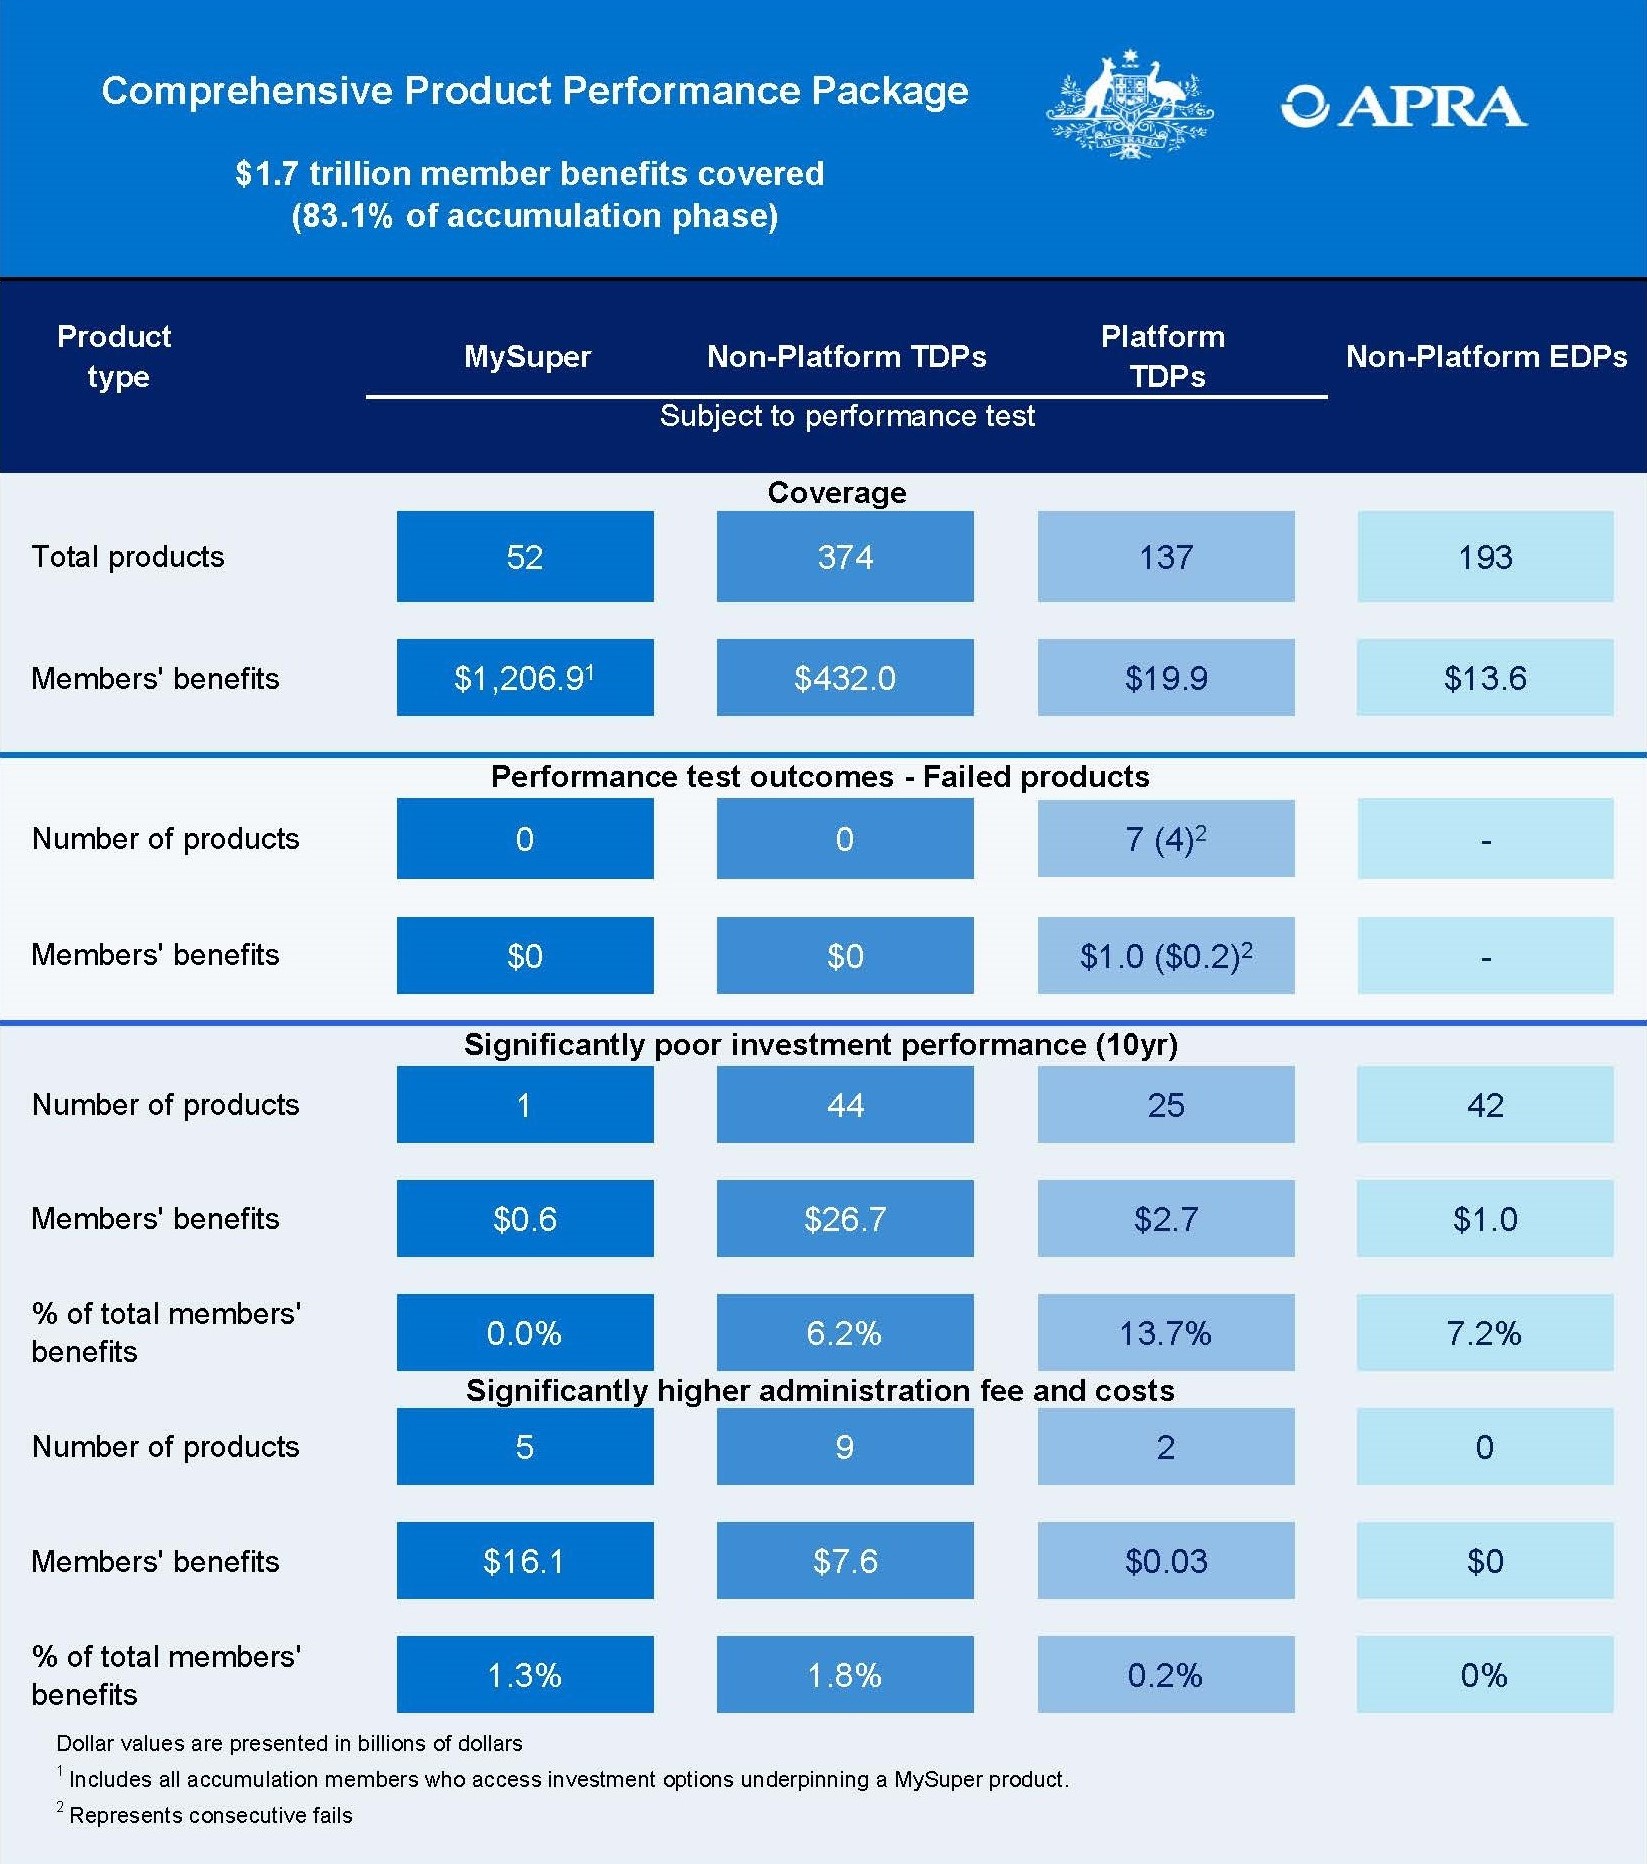 APRA has published an Insights Paper to illustrate the key insights from the data in the Comprehensive Product Performance Package, in particular identifying improvements to outcomes delivered to members and highlighting areas of poor performance.