Overview
APRA has decided to maintain its existing macroprudential policy settings. The mortgage serviceability buffer will remain at 3 percentage points, and the countercyclical capital buffer will stay at 1 per cent of risk-weighted assets. No other macroprudential policies are required to be introduced at this juncture.
These settings are under regular review and APRA will adjust its macroprudential policies to respond to emerging risks from changes in economic and financial conditions or to support the economy as required.
Policy considerations
Given the uncertainty regarding the economic outlook, ongoing geopolitical tensions, and cost of living pressures, APRA is confirming that the 3 percentage point serviceability buffer remains prudent. The buffer provides an important contingency over the life of the loan for unforeseen changes in a borrower’s financial circumstances.
The current level of the buffer has proven to be effective in improving the quality of lending. In particular, given the rapid increase in borrowing costs over the past 18 months, loan performance has remained sound; arrears rates and non-performing loan rates have increased only marginally and remain low (Chart 4.2). While some borrowers have been insulated from higher mortgage rates because they have been on low fixed-rate mortgages, most households who have rolled off to higher variable rate loans have continued to service their mortgages, in part because of the buffer applied to their loans at application.
Households have continued to service their mortgages despite cost of living pressures because of strong labour market conditions and the high liquid buffers they accumulated during the peak of the COVID pandemic. Nevertheless, households are experiencing financial pressures. Some households have reduced discretionary spending and used their liquid buffers to deal with higher mortgage repayments. Conditions in the labour market are easing, and employers have so far tended to reduce hours rather than the number of employees. Ongoing cost of living pressures, expected lower household income growth in the near term, and the potential for higher borrowing costs have supported the need to keep the mortgage serviceability buffer at 3 percentage points so that new borrowers have greater capacity to continue to service their loans should their financial circumstances deteriorate.
The serviceability buffer and higher borrowing rates have also contributed to a marked improvement in the average quality of new loans. This improvement has occurred without unduly constraining housing credit, which has slowed to around its long-term average rate of growth (Charts 1.1, 3.1, 3.2). Notwithstanding the slowing in credit, housing prices have returned to their peak of early 2022 (Chart 2.1). The increase in housing prices has been partially driven by the limited ability for supply to respond to the extra demand from stronger population growth. APRA will be monitoring the dynamic between housing prices and housing credit very closely.
Housing loan refinancing activity has been at record levels as borrowers more actively seek better deals for their mortgages. Banks have also been offering large discounts to retain customers. Some borrowers, however, have been unable to refinance their mortgage. While a small share of borrowers have been unable to satisfy serviceability criteria, others have been unable to refinance because of changes in personal financial circumstances and high loan-to-valuation ratios, among other reasons. Banks are able to apply exceptions to the serviceability buffer when appropriate, including for borrowers who are seeking to refinance, as long as the number of exceptions remain within an Authorised Deposit-taking Institution’s (ADI) risk appetite.
APRA is maintaining the counter-cyclical capital buffer (CCyB) at 1 per cent of risk weighted assets. Credit growth has stabilised around longer-term rates and there is no evidence to date of stresses emerging that would compromise banks’ ability to supply credit reliably to the economy. Recent bank stress tests also have demonstrated the resilience of banks to a severe stress and APRA has assessed that building further resilience in the system through raising the CCyB is not required at this point in the cycle (Chart 4.1).
Current conditions do not warrant the use of other macroprudential policy tools. In particular, there is not a strong case to impose lending limits given the recent improvement in the quality of lending and the rates of growth in investor and owner-occupier housing lending. Furthermore, asset prices do not appear to be driven by factors such as speculative activity or higher leverage, which might otherwise require different policy settings to protect the financial system.
Broader financial stability considerations
The persistence of inflation is creating more uncertainty about the economic outlook. Although goods price inflation has abated, services price inflation remains high and there is some uncertainty as to how long this will persist given growing labour costs, which are being exacerbated by negative labour productivity growth. In addition, there are risks of higher inflation from an increase in energy prices as a result of geopolitical tensions. In this scenario, there is the potential for further increases in borrowing rates, which would add to existing financial strains on households and businesses.
Some businesses are also experiencing financial pressure. Higher labour, material and interest costs and slowing demand have also contributed to a slowing in business credit and a rise in business insolvencies, particularly in the construction sector (Chart 1.2). Until recently, strong demand had enabled firms to pass on their higher input costs to prices. As demand slows, businesses will have less scope to raise prices in response to higher operating costs, which represents a risk to business profitability. Commercial real estate valuations have been falling in the office and retail segments due to cyclical and structural factors, such as weaker retail demand and working from home arrangements (see chart 2.2). However, current bank exposures to commercial real estate are low and do not pose a significant risk to the banking system.
Uncertainty in relation to the global policy and economic outlook has translated into more financial market volatility, particularly in longer-term sovereign bond yields. The restrictive monetary policy stance in advanced economies is expected to last longer than had previously been expected, reflecting strength in labour markets and the persistence in high inflation. The increase in longer-term interest rates will also increase the cost of servicing already high levels of government debt and could result in some tightening of fiscal policy in some overseas economies, which will slow global growth further.
Background
The objective of macroprudential policy is to mitigate risks to the financial system to ensure the financial system can continue to supply the credit and payment services required for the economy to grow at a stable and sustainable rate. APRA published a framework for macroprudential policy in 2021, which detailed the objectives, toolkit and implementation process.
APRA uses a broad range of economic and financial indicators and qualitative information to monitor emerging risks to financial stability. While risks to the financial system are the primary consideration for changes in macroprudential policy, APRA also considers the effect its macroprudential policy settings have on the competition and efficiency of the financial system.
APRA has responsibility to set macroprudential policy in Australia. In considering its settings, APRA consulted with the Council of Financial Regulators (CFR) at its September 2023 meeting. APRA regularly reviews its macroprudential settings and will continue to consult with the CFR.
Appendix
APRA tracks a broad range of indicators to monitor risks to the financial system. This includes four main indicators that provide a view of emerging systemic risks: credit growth and leverage; growth in asset prices; quality of lending; and financial resilience. Trends for these select indicators are shown in the charts below.
Credit Growth
Chart 1.1 Housing Credit Growth | Chart 1.2 Business Credit Growth* |
|---|---|
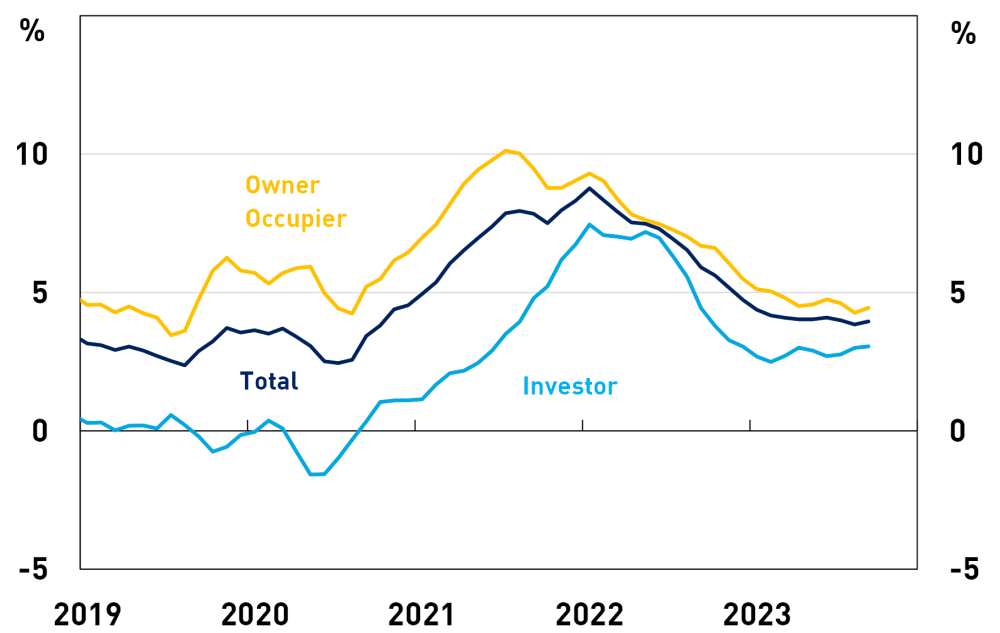
Source: RBA, APRA | 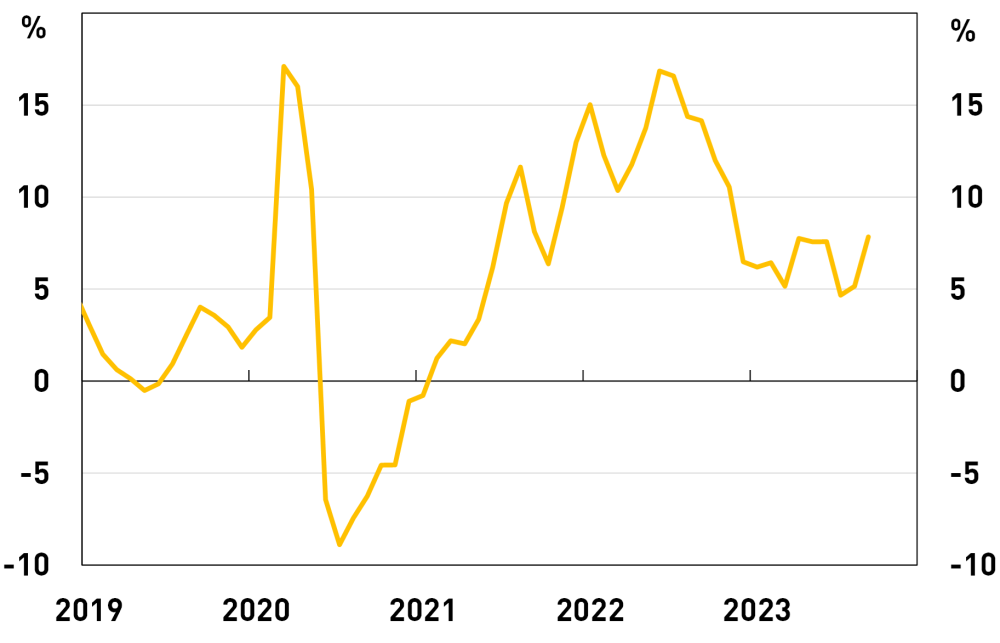
Source: RBA, APRA *Excluding financial businesses. |
Asset Prices
Chart 2.1 National Housing Price Growth | Chart 2.2 Commercial property values |
|---|---|
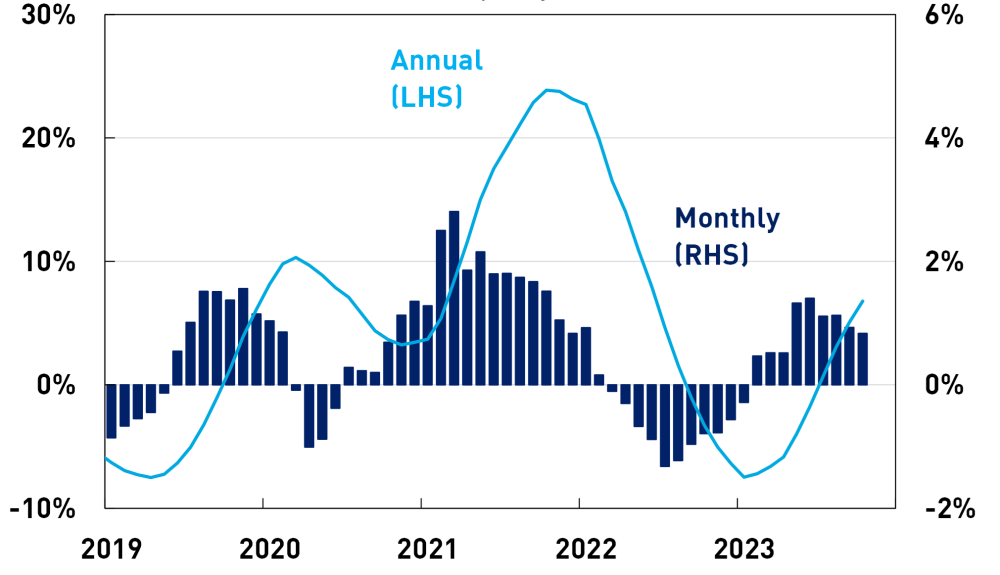
Source: CoreLogic, APRA | 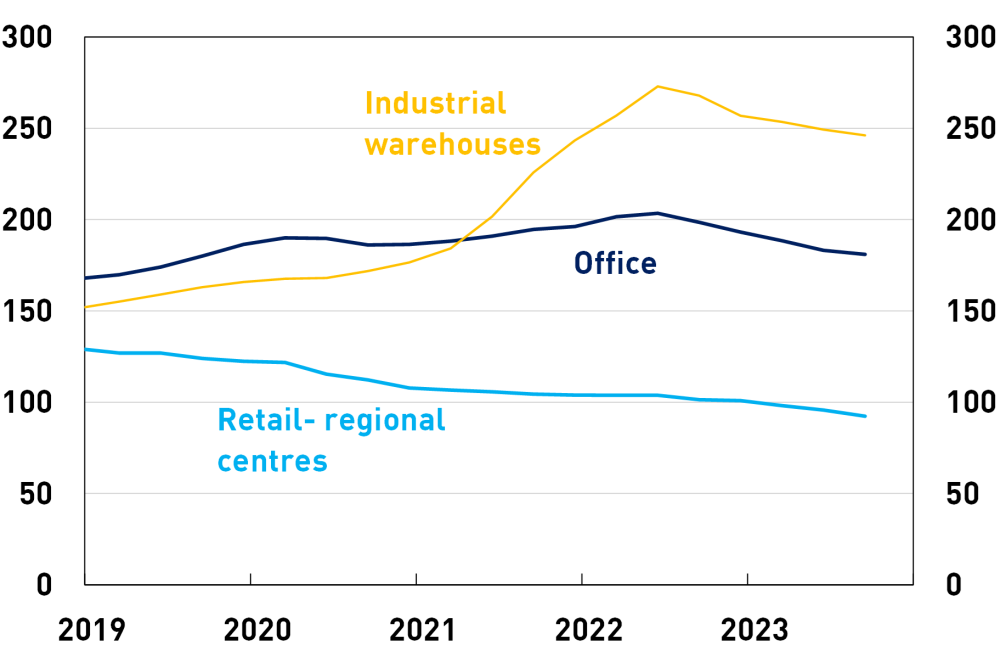
Source: JLL, APRA |
Quality of New Housing Lending
Chart 3.1 DTI ≥ 6x, share of new lending | Chart 3.2 LVR ≥ 90%, share of new lending |
|---|---|
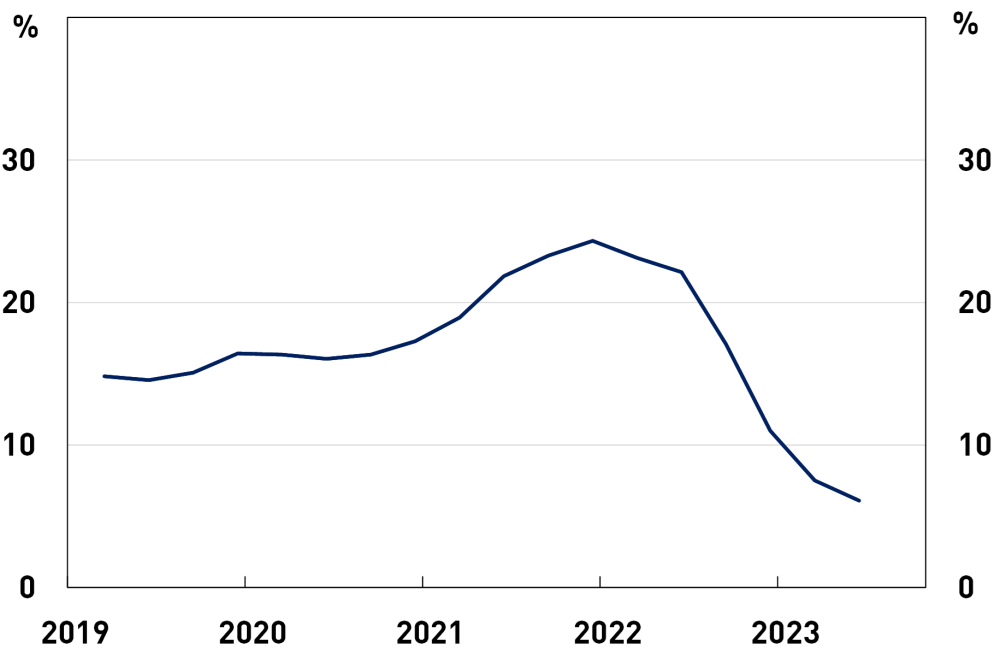
Source: APRA | 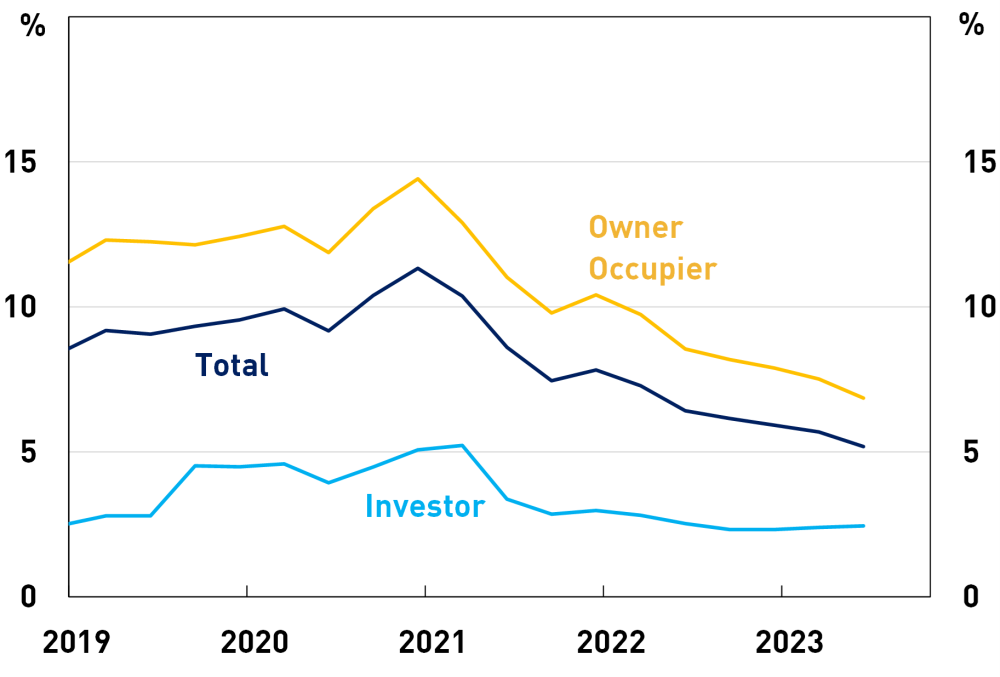
Source: APRA |
Financial Resilience
Chart 4.1 Capital base as a percentage of | Chart 4.2 Mortgage Arrears |
|---|---|
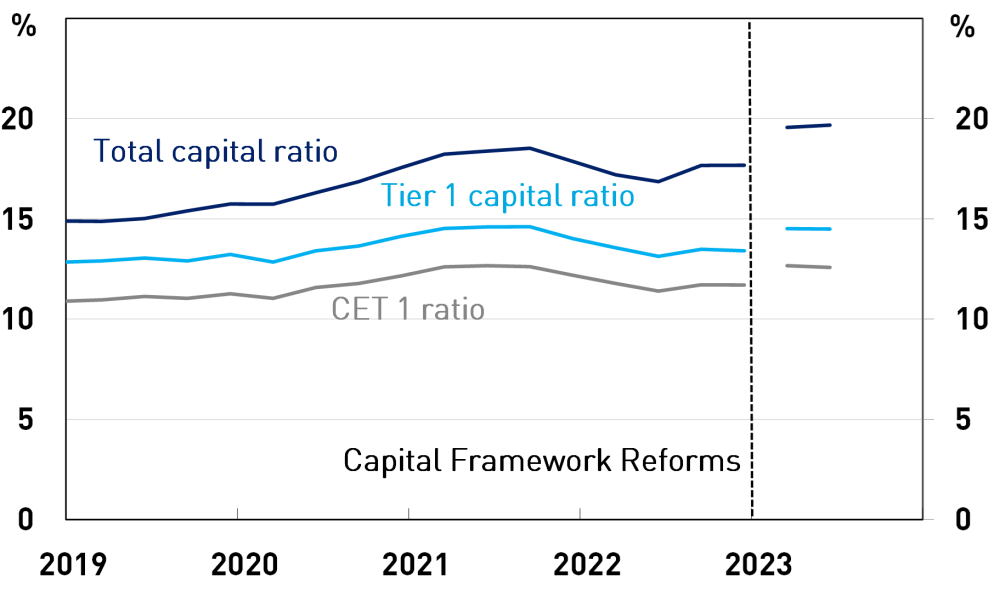
Source: APRA | 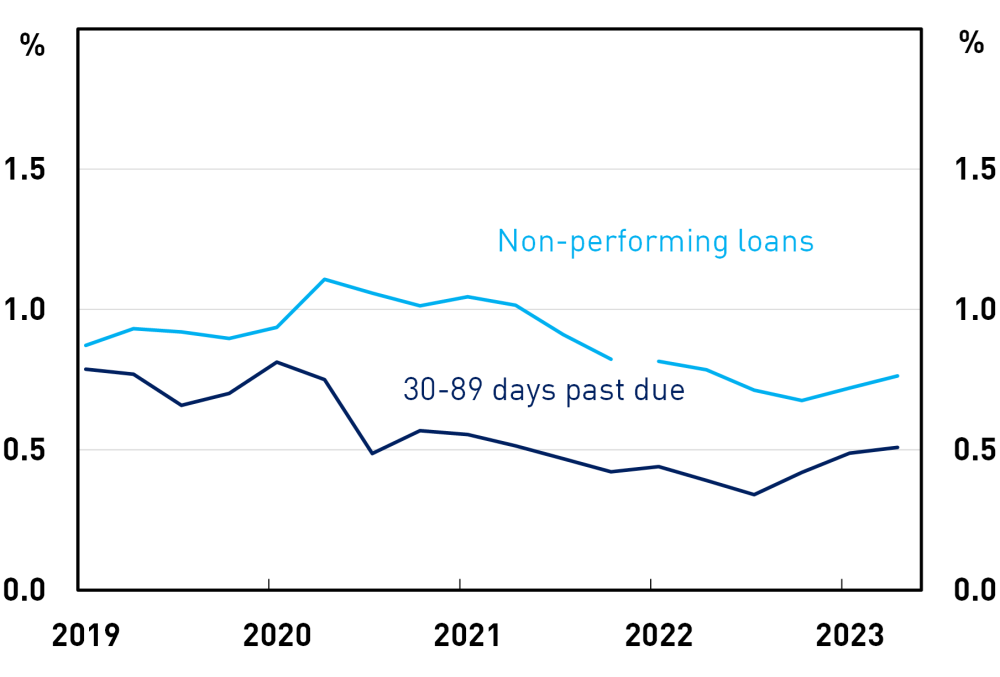
Source: APRA, series break is due to a definitional change. |