Quarterly authorised deposit-taking institution property exposure statistics - highlights
Key statistics 1
Key residential mortgage lending statistics for ADIs for the quarter were:
| ADIs' residential property exposures | March 2024 | March 2025 | Year-on-year change |
|---|---|---|---|
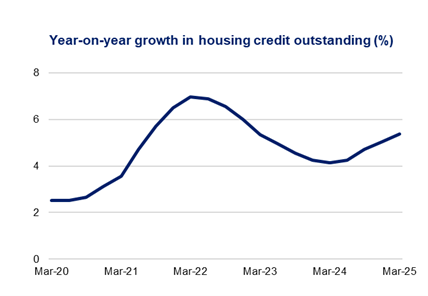
| Total credit outstanding ($bn) | 2,230.0 | 2,349.7 | 5.4% |
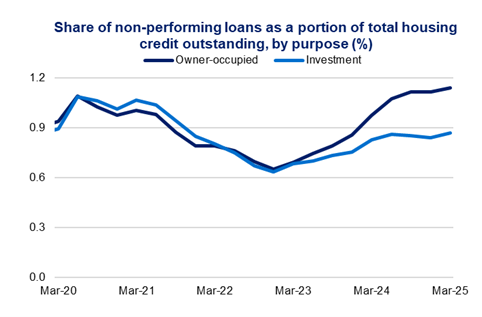
| Owner-occupied loans - share | 67.8% | 67.6% | -0.15 points |
| Investment loans - share | 30.3% | 30.4% | 0.14 points |
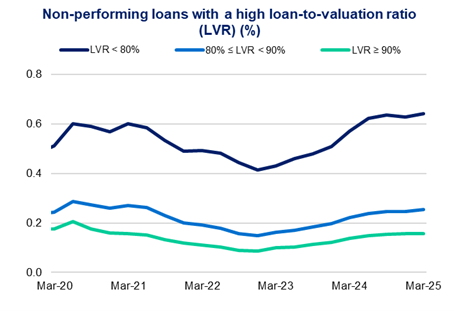
| Loans with loan-to-valuation ratio (LVR) ≥ 80 per cent - share | 17.8% | 17.0% | -0.77 points |
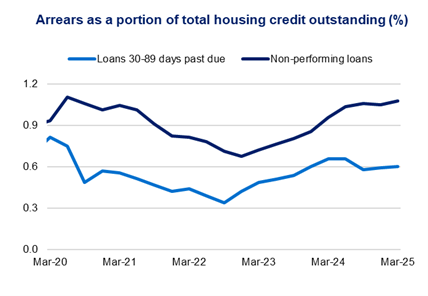
| Loans 30-89 days past due - share | 0.66% | 0.60% | -0.06 points |
| Non-performing loans | 0.96% | 1.08% | 0.12 points |
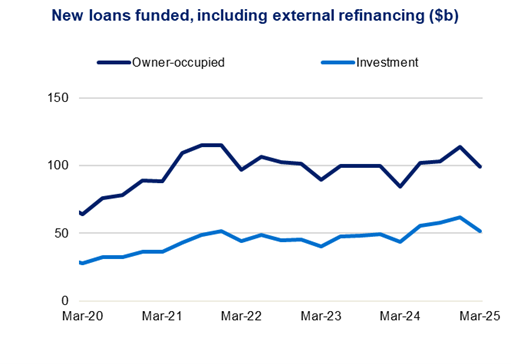
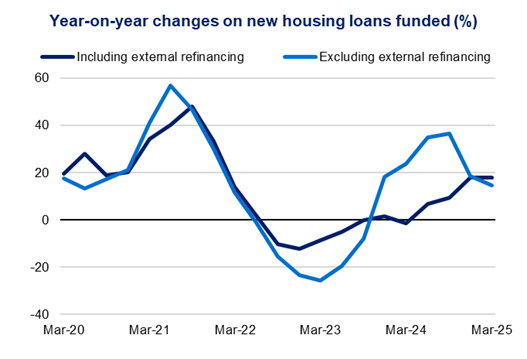
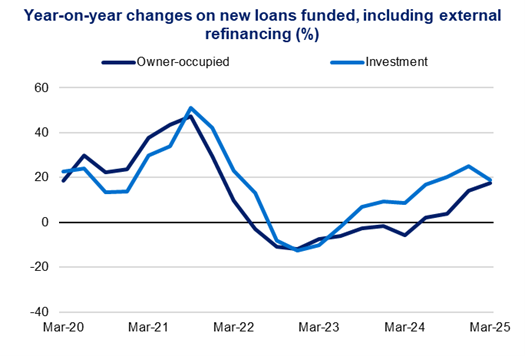
ADIs’ new loans funded during the quarter | March 2024 | March 2025 | Year-on-year change |
|---|---|---|---|
| New loans funded ($bn) | 131.1 | 154.7 | 18.0% |
| New owner-occupied loans funded - share | 64.6% | 64.3% | -0.31 points |
| New investment loans funded - share | 33.2% | 33.5% | 0.27 points |
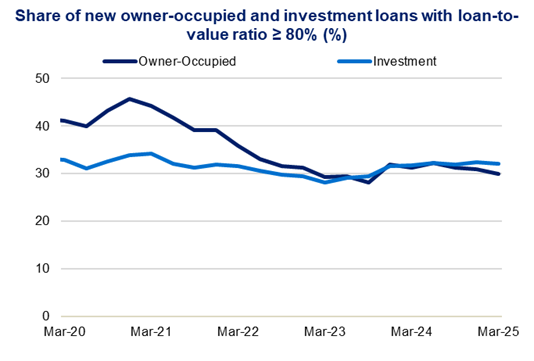
| New loans with LVR ≥ 80 per cent funded - share | 31.1% | 30.3% | -0.75 points |
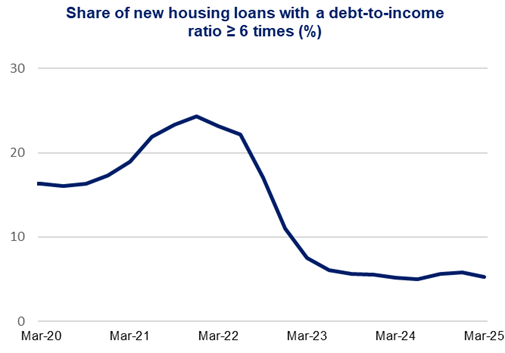
| New loans with debt-to-income (DTI) ratio ≥ 6x funded - share | 5.2% | 5.3% | 0.07 points |
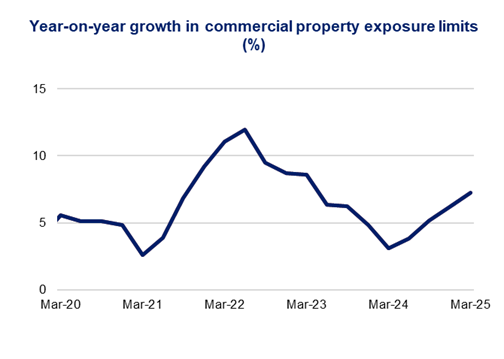
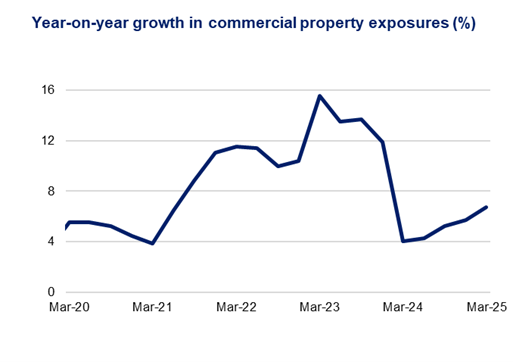
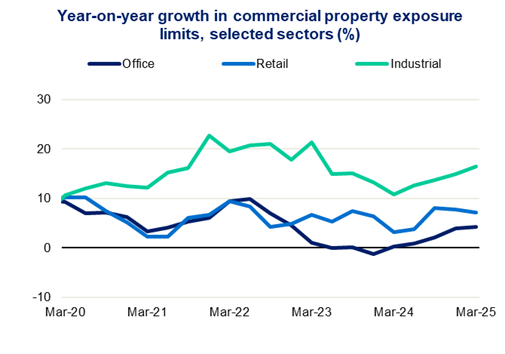
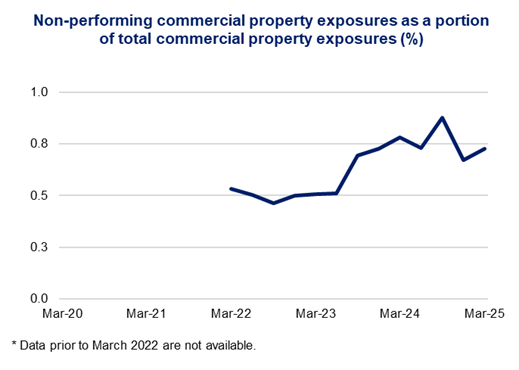
Key commercial property statistics for ADIs for the quarter were: