Delivering better member outcomes
Good afternoon everyone, and thank you for the invitation to speak to you today.
We’re now just eight days from Christmas, and I’m sure everyone involved with superannuation is looking forward to a well-earned rest after a year of extraordinary challenges and changes. At the beginning of the year I delivered a speech laying out APRA’s policy and supervision agenda for the year, titled 2020 Vision. It turned out our vision wasn’t quite as 20 20 as we might have liked, because the year panned out very differently to what we had anticipated.
With investment returns for superannuation funds with more than four members becoming negative for the first time in 11 years, and assets under management remaining static, it’s easy to perceive 2020 as a bad year for super members. But much actually happened this year that reflects well on trustees, and should give members confidence in the system into the future. The industry scrambled quickly and effectively to implement the temporary expansion of the early release scheme to support members facing financial difficulties due to COVID-19. That’s a sign of good governance and operational resilience. Investment performance held up well considering the scale of the global economic downturn and significant market volatility. And fees and costs across the MySuper sector continue to come down overall.
Unfortunately, this sound performance isn’t universal, and improving member outcomes through having persistently poor performers take actions to urgently lift their games or get out remains at the top of our superannuation agenda. Appropriately for the festive season, APRA has been making a list, we’ve checked it much more than twice, and the industry is about to find out who’s been – not naughty or nice – but performing or underperforming in the outcomes they deliver members.
APRA’s 2020 MySuper product heatmap, to be published tomorrow, is the first full refresh since it was launched last year. And while it might not be welcome news for all trustees, the evidence shows our heatmap has had a clear impact in improving member outcomes. It has also identified a rump of MySuper products that have materially underperformed for the second straight year, and we will be explicit tomorrow about which funds and products those are, and what we intend to do about it. For these reasons, we view the heatmap as a valuable component of our broader agenda to lift member outcomes, and one we intend to keep refining, expanding and publishing.
Unwrapping the findings
Compared to the 2019 heatmap, we’ve made small refinements to the methodology behind the 2020 version in response to industry feedback. But the purpose of the heatmap remains the same: to lift industry practices and enhance member outcomes by identifying which MySuper products are underperforming and the areas they need to improve.
We have made some changes to how we present the information, aimed at increasing the transparency, and therefore the effectiveness, of the heatmap. In particular, we will release an online, interactive web-based tool to help sort and filter the detailed information in the heatmap, in addition to the Excel and CSV file versions. The new web-based tool will deliver users increased functionality, including the ability to more easily sort by a number of filters, including registrable superannuation entity (RSE), MySuper product and more. This tool is being released in beta format because it is still being refined, but our hope is that it will make it easier for users to find what they are looking for.
We have also redesigned the Insights Paper that will once again accompany the heatmap’s release, with a greater emphasis on charts and graphics to explain our analysis. What our analysis shows is that the heatmap has made a substantial contribution to improving outcomes for MySuper members over the past year.
Key insights include:
- Of the 47 MySuper products that underperformed our investment performance benchmarks last year, 11 have now exited the industry;
- Of the 11 MySuper products with significantly high total fees and costs in the 2019 heatmap, eight have reduced their total fees and costs by an average of $166 p.a.1, and two have exited the industry; and
- Fees and costs continue to trend down overall, with MySuper members saving a total of $408 million in disclosed fees and costs since the first heatmap was published. That’s an average of $47 per member, for members in products with decreased fees and costs.
Other benefits are harder to measure but no less important. Trustees have a deeper understanding of their membership cohorts and product offerings than ever before. Also, there has been a remarkable correlation between the heatmap’s creation and trustees far more carefully scrutinising the data they report to us. In many cases, trustees have undertaken external review of their internal data processes. Having said that, we are still concerned at the amount of follow up we are having to do. This week we issued final warning letters to a number of trustees who are submitting their updated fees and costs data to APRA late, or not at all. Any further unauthorised delays in reporting will lead to sanctions.
Beyond these high-level key findings, the Insights Paper explores each of the three heatmap topics in greater detail and I wanted to give you a flavour of some of the insights that we will release tomorrow.
Performance relative to benchmark
While more than half the products (37 products) we assessed are performing at or above the heatmap investment benchmarks over six years, just under 40 per cent (27 products) are underperforming by up to 75 basis points, and nine per cent (six products) underperform by more than 75 basis points. Overall, we estimate that 900,000 members (or $31 billion in total assets as at 30 June 2020) are invested in the six MySuper products with significant investment underperformance.
Figure 1: Investment performance across MySuper products
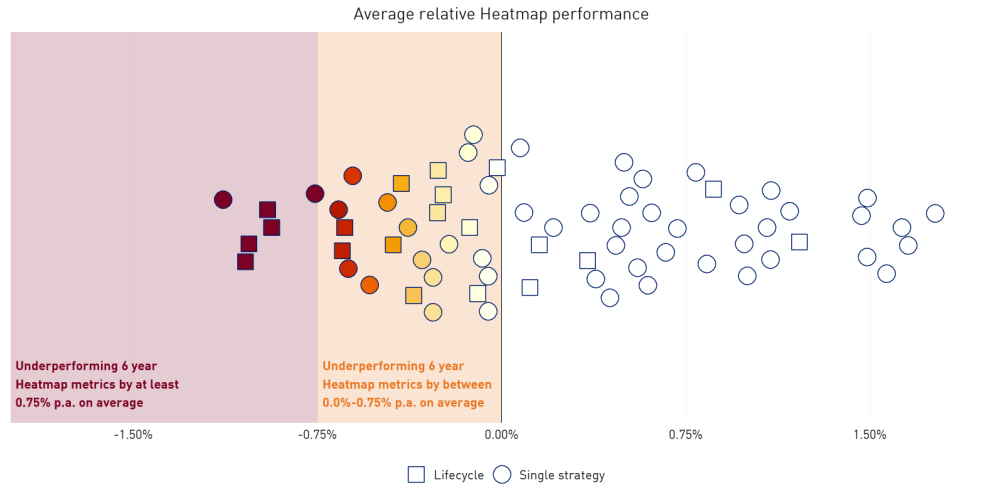
Note: APRA has calculated the average performance over 6 years for MySuper products against the four Heatmap benchmarks, to determine the ‘average relative Heatmap performance’.
Performance and size
APRA has raised concerns with some smaller funds about their ability to sustainably deliver good member outcomes in the future. Although size does not explain everything, this next slide does show larger funds generally have better performance. The chart plots the size of a fund (on a log scale) on the horizontal axis, and the risk-adjusted performance on the vertical axis. We have also included a standard line of best fit on the chart. Because the horizontal axis is on a log scale, the line of best fit appears curved. APRA expects the trustees of funds that have underperforming MySuper products – whether sub $5 billion or larger – to be considering whether they are able to achieve better performance, or whether they should consider merging or exit, as their size (or other factors) may be limiting their ability to do so.
Figure 2: Larger funds tend to perform better
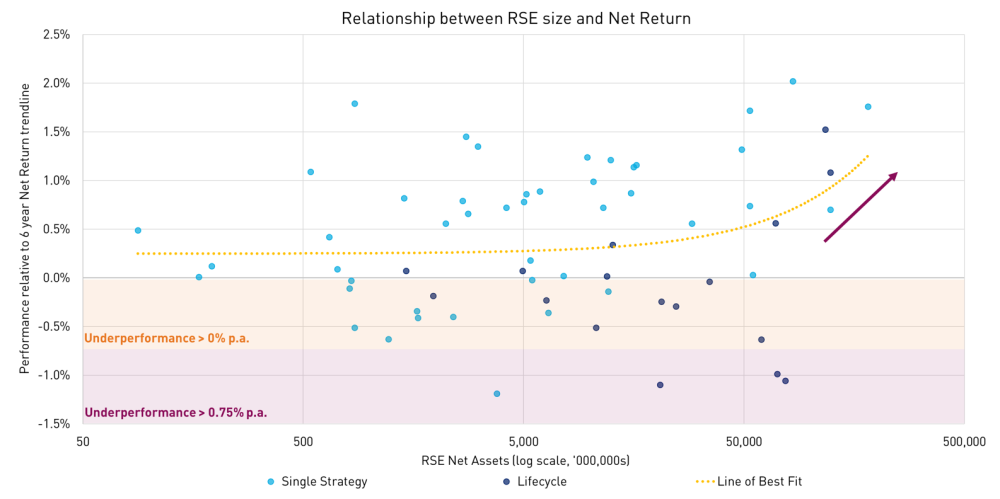
Note: Large employer MySuper products have been excluded from analysis. The line of best fit is a linear regression shown as a curve due to the log scale on the x-axis
Fees
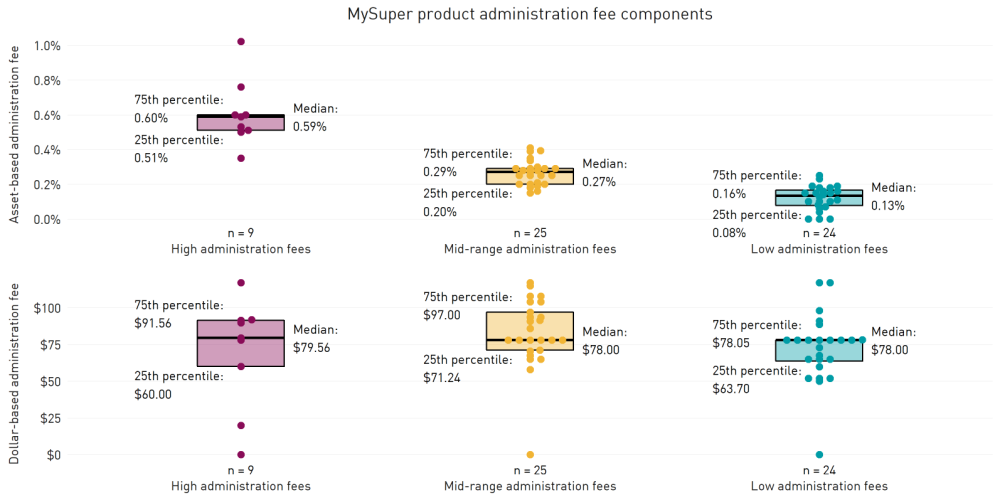
A number of MySuper products continue to have high fees and costs, largely due to high asset-based administration fees. This next slide shows the components of higher fees – let me unpack it for you.
The chart shows six box-and-whisker plots of administration fee components across three different groups of MySuper products: three for the asset-based component of administration fees (in the top half) and three for the fixed component of administration fees (in the bottom half). The three different groups of MySuper products are: the high fee products (on the left-hand side and in red), medium fee products (in the middle and in yellow) and low fee products (on the right-hand side and in green).
An interesting conclusion to be drawn from this chart is that the fixed component in administration fees (shown in the bottom half of the chart) is relatively similar across the groups. The significant difference comes in the asset-based fees: high-fee MySuper products appear to be driven by high asset-based fees. This causes APRA to ask – what is the justification for that fee structure? How is the trustee ensuring that this fee structure is in the members’ best interests?
We are doing work to scrutinise the trustee decision-making approach and analysis behind the types and levels of fund expenditure that ultimately translate into these fees, but more on that later.
Figure 3: Asset-based fees drive fee differences
Sustainability of member outcomes
Our analysis also shows that smaller funds with negative growth and cash flow trends face sustainability challenges. This chart shows the administration and operating expenses per active member for each fund in the horizontal axis, versus the 3-year average growth in total accounts. Each RSE is represented by a dot, with the size of the dot showing the total member accounts of the RSE. The bottom right quadrant is highlighted, showing those RSEs that have high administration and operating expenses per member and have shrunk in member accounts in the last three years. You can see the size of the dots in this quadrant are mostly small or medium, with the larger RSEs generally having much lower per member administration and operating expenses. The RSEs in this bottom right quadrant face a real sustainability challenge – their operating model is relatively expensive and they are shrinking. They have limited options to invest in changes to attract new members and grow the fund, and APRA considers that, for these RSEs, a merger or exit is likely to be in their members’ best interests.
Figure 4: Smaller funds with negative trends face sustainability challenges
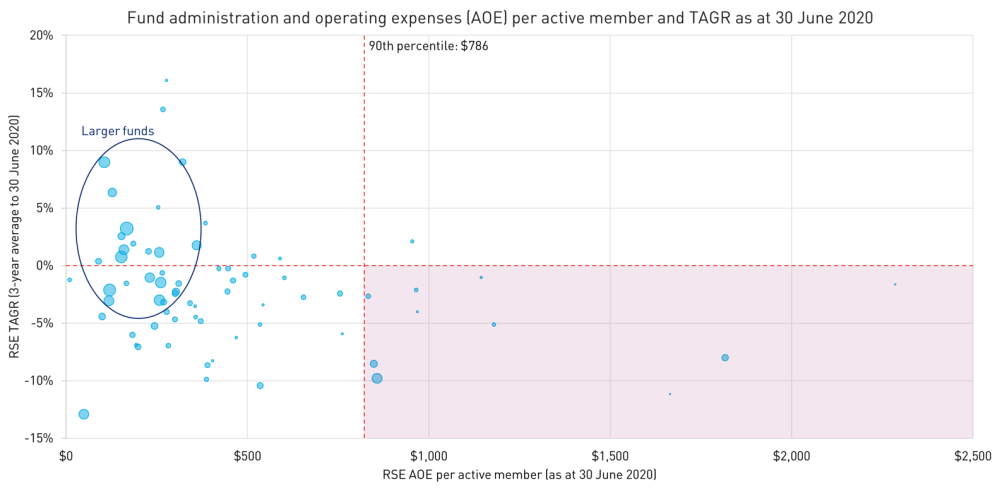
Note: Size of dots corresponds to the RSE’s number of total accounts as at 30 June 2020. ‘TAGR’ refers to an RSE’s Total Accounts Growth Rate.
Summary
Overall, this year’s heatmap paints a picture of a MySuper sector that is generally delivering sound outcomes to members, but with much room for improvement and some areas of concern. And it’s in this area that our transparency uplift goes beyond mere presentation. This year, our Insights paper quite explicitly names the products that are clearly underperforming across investment performance and fees, and those funds that are flagging on our sustainability measures. And largely they are the same names that showed up as red in last year’s heatmap. Being named on APRA’s underperformer list last year meant these entities have had a year to lift their game. But it’s clear that a stronger approach is needed to protect the members of those funds, and we will have more to say about the more formal steps we are taking in that regard when we release the new heatmap tomorrow.
Tying things together
In the wake of the Federal Government’s Budget measures on superannuation, and particularly the proposed performance test, questions have been asked about the future of the heatmap; in particular, whether it will remain necessary in years to come once the performance test has been implemented and the consumer-friendly “YourSuper” comparison tool is up and running. Provided the two are well aligned, we believe there is a clear role for both tools because APRA’s heatmap complements, rather than duplicates the “Your Future, Your Super” measures.
Unlike the proposed “YourSuper” comparison tool aimed at members, APRA’s heatmaps are primarily aimed at trustees, and also help to inform our own supervisory priorities. The heatmaps are one part of APRA’s work on improving member outcomes. The other pillars of this work are: strengthening our prudential framework, sharpening our supervisory focus, and enhancing superannuation data and insights. The heatmaps form part of the fourth pillar on improving industry transparency and sustainability. We strongly believe that APRA’s heatmaps can play an important role into the future, but they are not the sole mechanism that APRA is using to improve outcomes for superannuation members.
We didn’t make any material changes to this year’s heatmap in response to the Budget announcements, largely because the final form of the measures hasn’t been settled and legislated. We will review the heatmap and consider what changes may be appropriate once the legislation supporting the “Your Future, Your Super” measures is finalised. In the meantime, we continue to work to refine the methodology and expand the heatmap’s coverage.
For the 2021 version, we are considering a range of enhancements, including using a wider range of asset class indices in benchmark portfolios, and “stitching” of investment performance2 to help track long-term performance. In late 2021, APRA will also look to publish the heatmap for a segment of the choice sector; we will publish a preview of our thinking on how we will do this early in the new year. We also remain committed to extending our MySuper heatmap to include insurance. Given the complexity and limitations in data, this has been deferred until 2022 so we can leverage the expanded data collection that will be delivered through our Superannuation Data Transformation program.
The cost of inaction
A key objective of APRA’s strategic focus area to improve outcomes for superannuation members is to improve efficiency across the industry, including with respect to fees and costs, while maintaining high standards of governance and risk management. While the heatmap has had a positive impact in driving down fees and costs for members, some trustees are still charging what appear to be relatively high investment and administration fees given their investment performance and services. MySuper products are intended to be simple, low-fee products, yet the variation in administration fees that I showed you in the earlier chart translates into some members with a $50,000 balance paying more than two and a half times higher administration fees than members in other MySuper products.
The assessment of fees and costs for trustees is inherently complicated. Trustees must charge fees that are sufficient to pay for the technology, systems, staff and other operational costs needed to prudently invest (in most cases billions of dollars of) their members’ money. However, fees reduce the account balances that members will rely on in retirement. Managing the tension between these two realities in a way that meets their members’ best interests is therefore one of the most important roles that the trustee of any superannuation fund must perform. As the prudential regulator, APRA’s role is to ensure that trustees are doing this effectively.
The issue of what expenditure is or isn’t permissible under the legislation is not black and white – there are no items of expenditure that are explicitly prohibited. Rather, consistent with their legislative obligations, trustees are expected to be able to support their expenditure decisions with appropriate analysis and evidence of the benefits or outcomes to be delivered for members, and then monitor whether or not the expected results are actually delivered. If not, the trustee should review or cease the particular expenditure. These expectations, articulated in the enhanced fund expenditure requirements imposed by SPS 515 from 1 January 2020, are closely aligned with the Government’s proposed “Your Future, Your Super” reforms. These reforms will require trustees to comply with a more explicit duty to act in the best financial interests of members, with the onus placed on trustees to demonstrate that there was a reasonable basis to support their actions being consistent with members’ best financial interests.
With the introduction of SPS 515, APRA has been stepping up its scrutiny of expenditure in recent years, and will be seeking much more granular expense data on a routine basis as part of the Superannuation Data Transformation program. APRA has also recently written to a number of trustees, asking for additional information and supporting analysis on different types of expenditure, including advertising campaigns, TV programme sponsorship, sponsorships of sporting teams and payments to external organisations. If we conclude that fund expenditure by a particular trustee may not be consistent with the best interests of members or the sole purpose test, appropriate supervisory and/or enforcement action will follow. We are also seeking to identify both areas of good practice and areas where there is room for improvement, and expect to inform industry about our findings on an aggregate basis next year.
Reindeer games
I’ve talked a lot today about what APRA is doing, and a little about what Government is doing, but the more important issue is what trustees are doing to lift outcomes for their members. At a time of major industry disruption, good leadership has rarely been more important. Quite simply, better governance leads to better member outcomes.
It has been a challenging year, and more reforms are on the horizon, but that should not be an excuse for failing to invest in strategic thinking about long-term goals and what is needed to deliver good outcomes for members. The board’s primary role should be leading and shaping the strategy of the trustee to deliver for their members.
Prudential standard SPS 515 sets requirements in relation to strategic planning, monitoring and review. As trustees discuss the first Business Performance Review and Outcomes Assessments that have been done under SPS 515, our expectation is that these are not seen as compliance processes for APRA’s purposes but instead are used to reflect on your strategy, consider whether you are on track to achieve desired long-term goals, and what changes need to be made to ensure you are well positioned to deliver good member outcomes on an ongoing basis. This may mean tough calls for some trustees, but those with the right mindset and maturity will be able to make them.
In responding to the heatmap, although not widespread, we’ve seen some trustees clearly modifying their investment decisions in an attempt to manage their performance to the heatmap benchmarks. Others have tried to rewrite history by resubmitting data to present their funds in a more favourable light. These kinds of games indicate poor leadership, are not indicative of a mindset that is genuinely seeking the best outcomes for members and certainly won’t get those trustees off APRA’s underperformer list!
The gift that keeps on giving
Next year will mark 30 years since the introduction of the compulsory superannuation guarantee. The industry has evolved enormously in that time, and nearly every change – however challenging for trustees at the time – has created a stronger system that delivers better results for members.
The pace and magnitude of some of the changes the industry faces right now are substantial, and have the potential to significantly alter the landscape for many funds. The next few years look set to challenge trustees to look long and hard at what they offer for their members and how they remain relevant and competitive in a rapidly evolving industry. Transparency and disclosure have never been higher, which puts more power in members’ hands. Trustees that don’t recognise these realities and lift their standards accordingly may not see their funds around much longer.
Not every trustee or superannuation analyst likes APRA’s heatmap or the methodology behind it, but it has demonstrably helped to deliver better member outcomes. By harnessing the power of transparency, trustees – and APRA – can more easily see where funds are falling short, so they can take steps to fix weaknesses. And for those doing relatively well, they can see that standing still may mean that their competitors will overtake them. For that reason, we intend to return each year, a bit like the Christmas Grinch, to put the trustees of underperforming funds on notice to lift their game or get out. It may not be the Christmas present they were hoping for, but if trustees respond with lower fees or improved investment performance, there could be no better gift for the members they ultimately serve.
Footnotes:
1 For the representative member with $50,000 account balance.
2 To maintain the long-term investment performance history of MySuper products, APRA intends to map (or ‘stitch’) the performance of products that have undertaken a variety of changes, such as fund mergers, or product consolidations.