Countercyclical capital buffer
Executive summary
Banks hold capital to ensure that they can absorb losses, retain the confidence of their creditors, and continue to lend, even during a severe downturn. The countercyclical capital buffer is an additional amount of capital that APRA can require authorised deposit-taking institutions (ADIs) to hold at certain points in the economic and financial cycle. The primary purpose of the countercyclical capital buffer is to increase the resilience of the ADI sector during periods of heightened systemic risk. The buffer was set at zero per cent of risk-weighted assets upon its introduction in 2016, and has remained unchanged.
APRA reviews the level of the buffer on a quarterly basis. One major input to these decisions is a set of core systemic risk indicators that cover credit growth, asset prices, lending conditions and financial stress. These decisions are also influenced by APRA’s broader thinking on systemic risk and the economic environment. Other relevant considerations include the pre-existing level of ADI resilience, prudential measures in place, and other macroprudential tools available to APRA. Input is also sought from other members of the Council of Financial Regulators.
APRA considers that a zero per cent countercyclical capital buffer remains appropriate at this point in time. Key features of the systemic risk environment over the past year include low credit growth, a steady risk profile for new housing lending, a move from declining house prices to rising house prices in many locations, and increased operational risk losses. Past episodes of rapidly rising house prices have often been accompanied by increases in household indebtedness and declining lending standards. Low interest rates may also give banks an incentive to increase the riskiness of their lending. APRA is carefully monitoring these dynamics, but there is no notable evidence of increased systemic risk that has emerged to date. The countercyclical capital buffer will be increased if conditions emerge that warrant it. There is also a range of other macroprudential tools that APRA can activate if required.
As part of the upcoming reforms to strengthen the ADI capital framework, APRA is likely to include a non-zero default level of the countercyclical capital buffer. As foreshadowed in APRA’s August 2018 Discussion Paper, Improving the transparency, comparability and flexibility of the ADI capital framework, additional buffers would increase the flexibility of the ADI capital framework, particularly in times of stress1. The revised ADI capital framework is expected to come into effect in January 2022.
Footnotes:
1 See Discussion Paper: Improving the transparency, comparability and flexibility of the ADI capital framework, 14 August 2018.
Glossary
ABS | Australian Bureau of Statistics |
|---|---|
ADIs | Authorised deposit-taking institutions, which includes banks, building societies and credit unions. |
APRA | Australian Prudential Regulation Authority |
APS110 | Standard APS 110 Capital Adequacy |
Capital conservation buffer | An additional layer of Common Equity Tier 1 Capital above the minimum regulatory requirement that can be utilised in times of stress to absorb losses, subject to constraints on dividends and other distributions. See APS 110 for further information. |
Countercyclical capital buffer | An extension of the capital conservation buffer that can be imposed by APRA to protect the banking sector from systemic risk. |
Credit | Credit provided by financial institutions operating domestically. |
Credit-to-GDP gap | The difference between the credit-to-GDP ratio and its long term trend. |
GDP | Gross domestic product |
LVR | Loan-to-value ratio |
RBA | Reserve Bank of Australia |
Chapter 1 - Countercyclical capital buffer decision
APRA requires banks to hold capital to ensure that they can absorb losses, maintain the confidence of their creditors, and continue to lend, even during a severe downturn. Capital protects bank creditors, including depositors, and ensures that the banking system can continue providing its essential payment and lending functions. Most of APRA’s capital requirements for authorised deposit-taking institutions (ADIs) do not vary over the economic cycle.
The countercyclical capital buffer, which has been part of APRA’s capital adequacy framework since 2016, is different. This buffer is an additional amount of capital – equivalent to between 0 and 2.5 per cent of risk-weighted assets – that APRA can require ADIs to hold at certain points in the economic and financial cycle. APRA’s primary objective when adjusting the countercyclical capital buffer is to proactively build the resilience of the banking sector during periods of increasing systemic risk. The additional buffer can then be reduced or removed during subsequent periods of stress to reduce the risk of the supply of credit being impacted by regulatory capital requirements.
APRA set the level of the countercyclical capital buffer applying to ADIs at zero per cent upon its introduction on 1 January 2016, and it has remained unchanged since2.
APRA reviews the level of the countercyclical capital buffer on a quarterly basis. These reviews take into consideration a set of core financial indicators, the broader level of systemic risk, the overall economic environment, and the availability of alternative macroprudential tools and supervisory measures when considering whether to activate or adjust the countercyclical capital buffer. Input on the level of the buffer is also sought from other agencies on the Council of Financial Regulators, particularly the Reserve Bank of Australia.
APRA considers that a zero per cent countercyclical capital buffer remains appropriate at this point in time.
Key features of the systemic risk environment over the past year include low overall credit growth, minimal change in the risk profile of new housing lending, significant changes in housing price growth, and increased costs from operational risk events and misconduct.
Lending by financial institutions has grown slowly over the past year. Housing credit growth is very low by historical standards, accompanied by similarly low growth in household income. Owner-occupier lending now accounts for a much larger share of new housing borrowing than in the recent past. Lending to businesses, including commercial property lending, also grew at a slow pace over 2019.
At a system level, housing lending standards do not appear to have loosened over the past year. The shares of new lending undertaken at high loan-to-value ratios (LVRs), or on an interest-only basis, were stable over 2019. The share of new lending undertaken at high debt-to-income levels has also been broadly stable over the past two years.
Housing prices began to rise at a rapid pace in Sydney and Melbourne during the second half of 2019. This follows significant falls in prices in these cities over the preceding 18 months. This shift in price momentum has broadened to other capital cities and some regional areas over recent months. At the same time, prices remain significantly below their peak levels in some areas, particularly in parts of Western Australia, Queensland, and the Northern Territory.
The housing loan arrears rate was around 1 per cent of loans in the September quarter, which is low in absolute terms but nevertheless high historically. At the same time, arrears rates rose in all states other than Tasmania over the first half of 2019, and so should continue to be closely monitored. Operational risk losses, and other factors such as low interest rates, are likely to continue to be headwinds for bank profitability.
Overall, this systemic risk environment is consistent with APRA keeping the countercyclical capital buffer at zero per cent of risk-weighted assets. There have not been large increases in the volume or riskiness of bank lending, though there are indications that housing credit growth may increase over coming months. While some asset prices are increasing at a fast pace, some of these increases follow significant falls, and prices of other assets continue to decline. Bank profitability fell in recent reporting periods, but it remains relatively high by international standards.
APRA remains alert to changes that could increase systemic risk. Over the coming year, APRA will, together with its normal monitoring, closely watch for evidence of any of the following developments:
- significant increases in credit growth;
- increases in household indebtedness;
- excessive exuberance or speculation in systemic asset markets;
- declining lending standards for housing or business lending; and
- increases in non-performing loans and other measures of financial stress.
Past episodes of rapidly rising house prices have often been accompanied by increases in household indebtedness and deteriorations in lending standards. In addition, a low interest rate environment may give banks an incentive to increase the riskiness of their lending in search of market share. While there is as yet little evidence of these dynamics, APRA continues to monitor them closely.
APRA will adjust the level of the countercyclical capital buffer should future conditions warrant this. In addition, there is a range of other macroprudential tools that APRA can deploy to help mitigate systemic risks, if conditions develop that require this. This is particularly true in respect of housing market risks, where a range of tools can be used to target higher risk types of lending if needed.
A non-zero default level of the countercyclical capital buffer is likely to form part of APRA’s broader reforms to the ADI capital framework. A non-zero default buffer would remain at a positive level when systemic risk is neither elevated nor low, which should be true most of the time. A positive default level will increase the likelihood that APRA can respond to a downturn or a materialisation of systemic risk by reducing the buffer. Having this option to reduce the buffer provides flexibility which is particularly valuable in an environment where material downside risks to the outlook exist. APRA will commence the next stage of consultation on the broader reforms including this capital buffer in the first half of 2020.
Footnotes:
2 See Media Release: APRA announces countercyclical capital buffer rate for ADIs, 17 December 2015.
Chapter 2 - Systematic risk assessment
The following section summarises APRA’s current assessment of the systemic risk environment, focusing on developments that have driven countercyclical capital buffer decisions. A key tool in this assessment is a set of core indicators that form part of APRA’s framework for the countercyclical capital buffer (listed in the table below). As discussed in the last annual Information Paper on the countercyclical capital buffer, this set of core indicators was expanded in late 20183.
There is no mechanical link between any indicator and the level at which APRA sets the buffer. Buffer decisions are based on primarily on judgement, taking into account all available information. This flexible approach is in line with that used by most of the countries that have a countercyclical capital buffer as part of their bank capital framework.
| Risk area | Core indicators |
|---|---|
| Credit growth | Credit–to-GDP gap Housing credit growth Investor housing credit growth* Business credit growth Commercial property exposures growth* Household debt to income annual change* |
| Asset prices | Commercial property price growth Housing price growth |
| Lending indicators | Higher-risk residential mortgage lending Business lending conditions Loan pricing and margins |
| Financial stress | Non-performing loans Return on equity* |
* New core indicator announces in 2018.
Credit growth
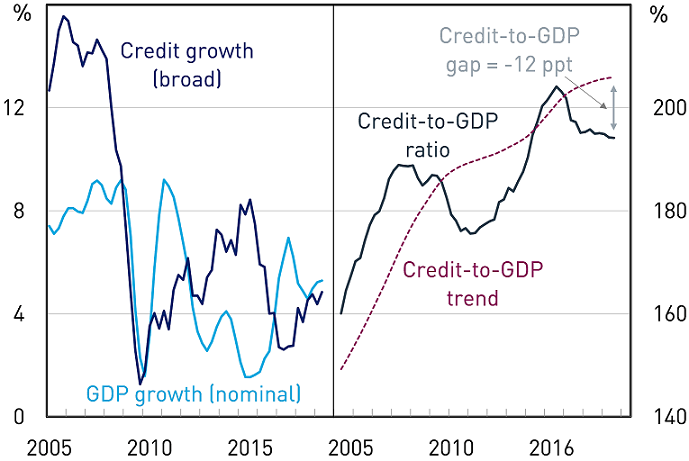
The credit-to-GDP gap is the difference between the credit-to-GDP ratio and its long-run trend4. A credit-to-GDP ratio significantly above its long run trend (a positive gap) could indicate excessive credit growth. The credit-to-GDP gap in Australia has been negative since late 2016. The gap has decreased further (become more negative) over recent years as credit has generally grown more slowly than nominal GDP.
The credit-to-GDP gap is the only indicator mandated in the Basel Committee guidance on how countries should operate the countercyclical capital buffer. While it has been found to be a useful early warning indicator of banking crises in some studies, it is acknowledged to not be useful for all countries and at all points in time. In Australia, credit has grown at a rapid pace over recent decades. This rapid credit growth has given the credit-to-GDP ratio a strong upward trend that does not accord with APRA’s assessment of prudent levels of credit growth. Largely for this reason, APRA does not place a heavy weight on the credit-to-GDP gap when assessing systemic risk or setting the countercyclical capital buffer. This accords with the practice in most countries that have adopted the countercyclical capital buffer.
Credit and GDP - last data point is June 2019
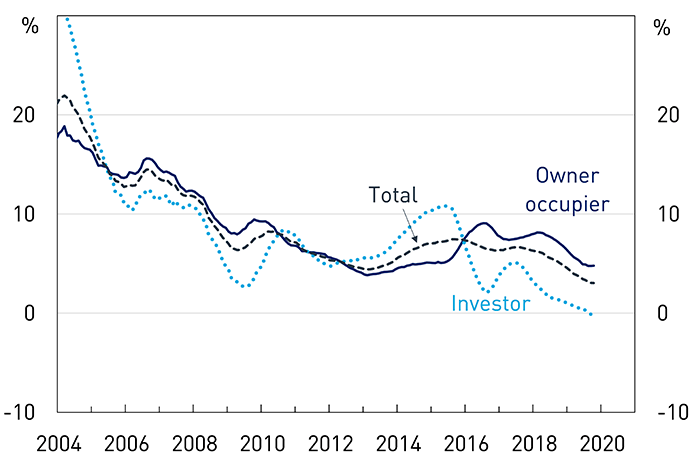
Housing credit, the largest component of borrowing by the non-financial sector in Australia, has grown at a historically low rate over the past year. Annual growth in housing credit over the 12 months to October was 3 per cent, which is the lowest growth rate since the beginning of this data series in the 1970s. This reflects a number of factors, including low growth in nominal household income and subdued housing market conditions over most of the past year. All of the growth over the past 12 months was in lending to owner-occupiers, as lending to investors did not grow over this period.
Housing Credit Growth - Annual
Owner-occupier credit growth has strengthened somewhat in recent months, and loan approvals data suggest this trend is likely to continue in the near future. Monthly owner-occupier commitments for new loans increased by 17 per cent between May and September. Investor loans commitments have also increased, but to a smaller extent, suggesting demand for credit from investors has remained limited to date.
Housing loan commitments
Seasonally adjusted, excluding refinancing
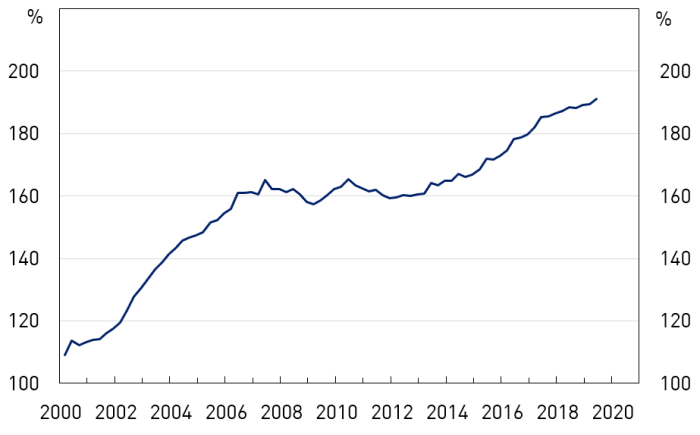
Whilst historically slow, growth in household debt has been faster than growth in household income in Australia in recent times. The net result of this was an increase in the household debt-to-income ratio of 3 percentage points over the year to June 2019. The household debt-to-income ratio is high in Australia compared to an average of other advanced countries and is therefore notable in the assessment of systemic risk levels.
Household debt to income
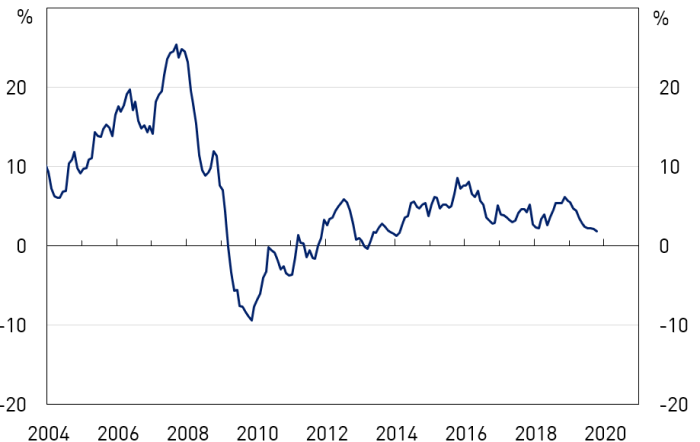
Business credit growth has been somewhat weak over the past year. Over the six months to October, it grew by around 2 per cent in annualised terms. Lending for commercial property, a component of business credit, has also been growing slowly recently. Data from the ABS and listed companies’ financial accounts indicate that leverage in the broader business sector remains at moderate levels.
Business credit growth
Six month annualised growth
Asset prices
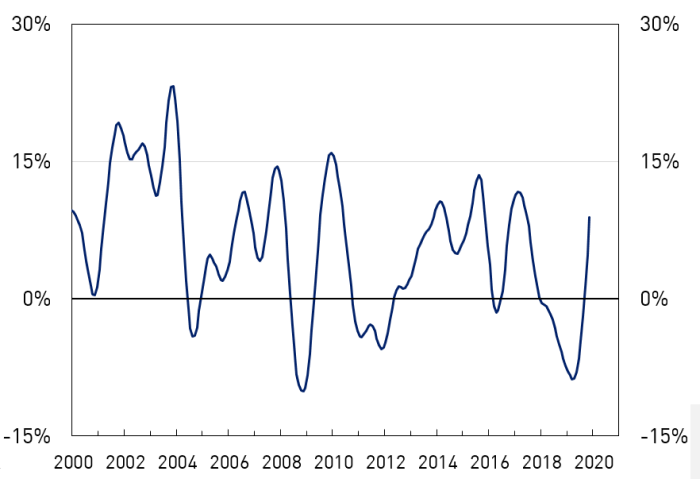
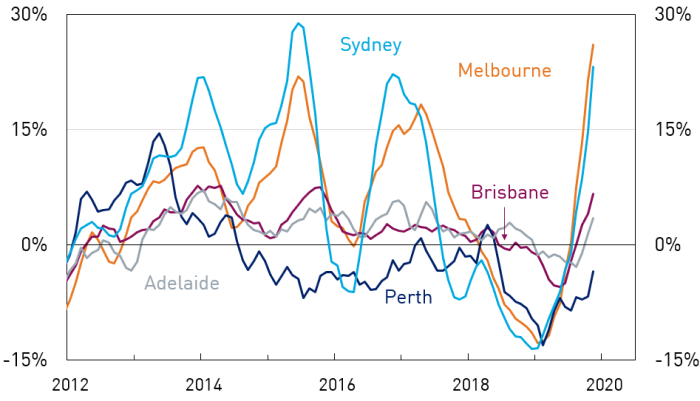
At a national level, housing prices fell during 2018 and the first part of 2019. This national fall was driven by falls in Sydney, Melbourne, and Perth. Prices in Sydney and Melbourne declined by 15 and 11 per cent, respectively, from peak to trough. Prices began rising in Sydney and Melbourne in mid-2019, and are now rising at a fast pace. Over the three months to November, prices in Sydney and Melbourne rose at annualised rates of 23 per cent and 26 per cent respectively. The increase in price momentum has broadened over recent months. Prices have begun rising in some other capital cities, including Brisbane and Adelaide, and the pace of price declines has moderated in others.
Housing price growth in Australia
Six-month annualised; seasonally adjusted
Housing price growth in selected capital cities
Three-month annualised; seasonally adjusted
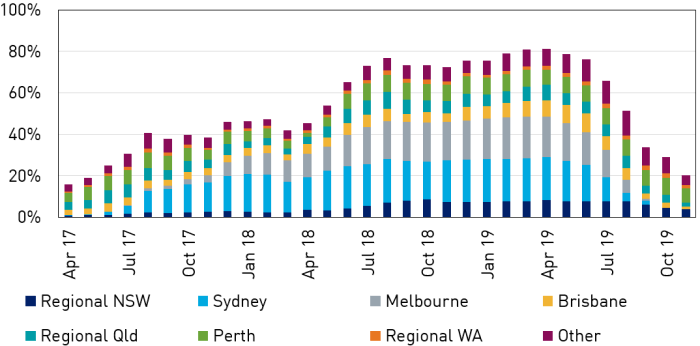
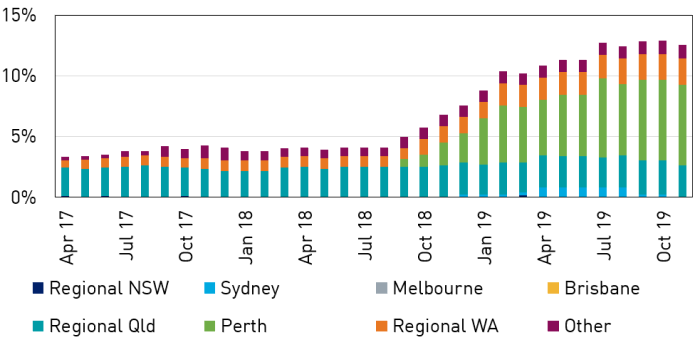
Despite positive price momentum in capital cities, prices continue to decline in other parts of the country. Over the three months to November, prices declined in areas where around 20 per cent of the Australian population live5. These areas include parts of Perth, Darwin and Brisbane, as well as regional areas in Western Australia, Queensland and New South Wales. The broad-based falls in house prices over 2018 and the first half of 2019 mean that there are a number of areas where prices remain significantly below their peak level. This is most evident in Western Australia, regional Queensland and the Northern Territory.
Share of areas with falling prices*
Share of areas with prices 20 per cent or more below peak*
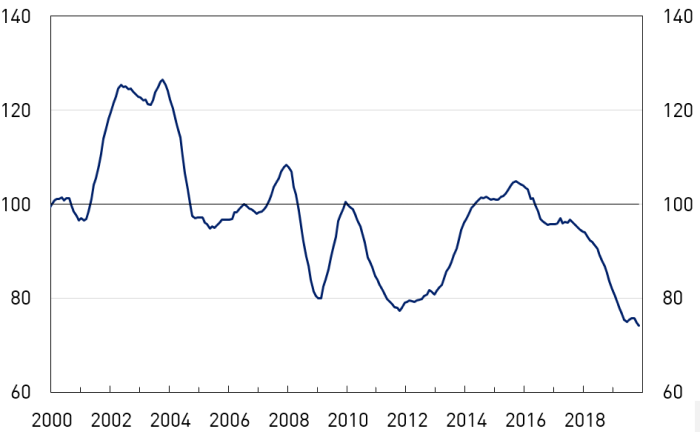
A number of factors likely underlie the change in price momentum seen over recent months. These include the recent declines in variable mortgage rates following reductions in the RBA’s cash rate, the removal of policy uncertainty following the federal election, and APRA’s loosening of serviceability requirements. Housing turnover also remains at a subdued level. At present, price increases have not been driven by large increases in household credit or borrowing (as discussed above) or a loosening in lending standards (see below).
Housing turnover
Index, year 2000 average = 100
Valuations of office and industrial properties continued to increase rapidly over the past year. In contrast, prices of retail commercial properties fell by around 5 per cent. While commercial property exposures make up only a small share of banks’ total credit exposures, they have the potential to experience high loss rates during downturns. Commercial property lending accounted for a large proportion of banks’ losses during the downturn of the early 1990s and in the aftermath of the global financial crisis; they also typically account for a significant share of losses in APRA’s bank stress tests.
Lending indicators
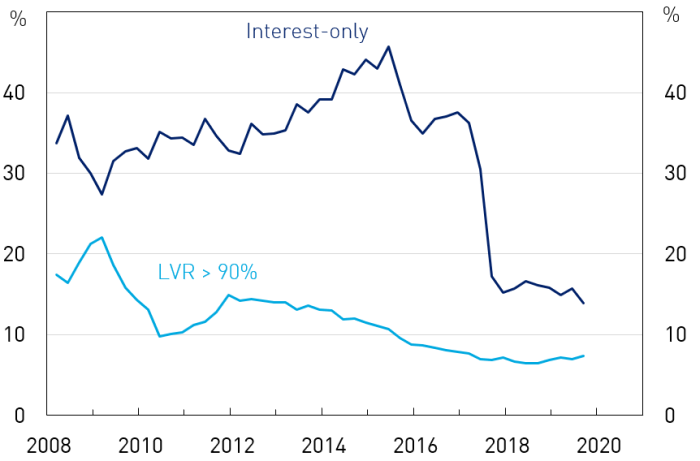
Across banks the aggregate risk profile of new housing lending has been fairly stable over the past year. The share of new lending undertaken at a loan-to-value (LVR) ratio above 90 per cent remained steady at around 7 per cent, and the share that is interest-only declined slightly to be around 14 per cent. Consistent with the discussion of credit growth above, the share of new lending that was investor lending was 30 per cent over the past year. All of these shares are significantly lower than levels prevailing in 2014. These changes have been driven, in part, by a significant program of work by APRA, which included both guidance on lending standards and temporary quantitative benchmarks on higher-risk types of lending6.
Higher-risk housing lending
Shares of new housing loan approvals
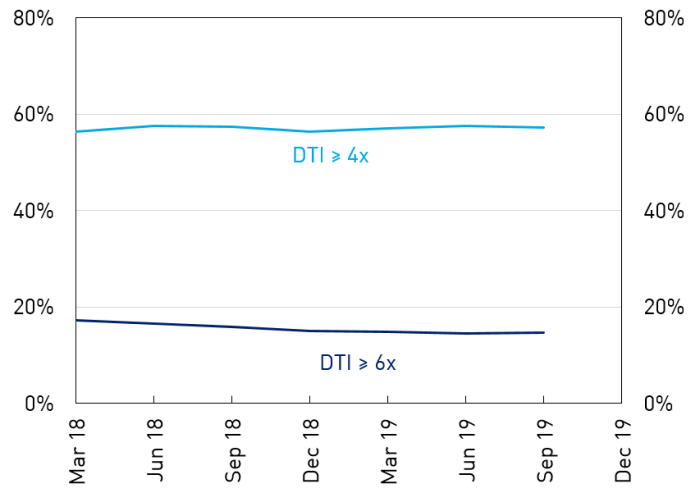
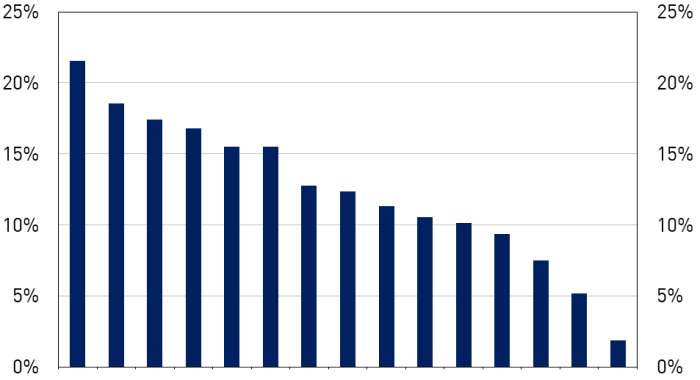
APRA has invested in collecting additional data on residential mortgages over recent years. In particular, APRA now collects new lending by loan-to-income (LTI) and debt-to-income (DTI) ratios. These measures provide a view on the vulnerability of lenders and borrowers to income shocks. For example, a borrower with a high debt-to-income ratio may be more likely to default on mortgage repayments during a period of unemployment. The shares of new mortgage lending undertaken at high DTI levels have been fairly stable over the period in which this data has been collected. These aggregate levels mask some variation in lending standards across banks. Some large ADIs extend a significantly greater share of their mortgage lending at high DTIs.
High DTI, share of new lending
DTI >= 6 times, Share of new lending
15 large ADIs, average over last year
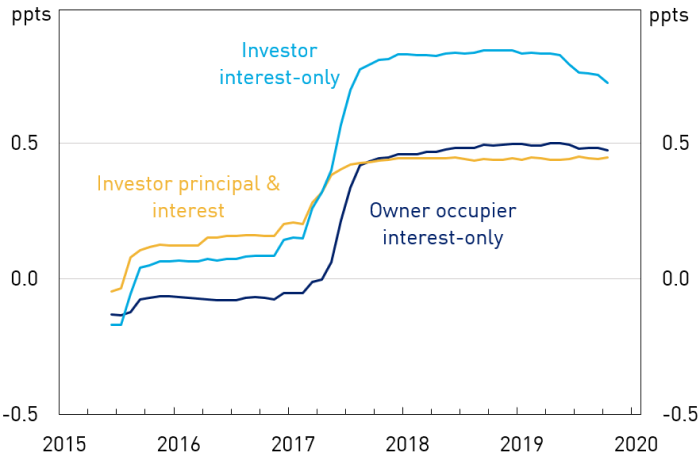
Banks can alter the composition of their new housing lending by offering different pricing on different product types. Differential pricing emerged during the period when APRA’s quantitative benchmarks on investor and interest-only lending were in force, and involved significant spreads between these mortgage types and owner-occupier principal and interest loans. The extra spread charged for one type of loan – investor interest-only – has declined modestly over recent months. Further declines in this spread, and therefore declines in interest rates on interest-only and investor lending, may lead to increases in investor and interest-only lending.
Interest rates on outstanding housing loans
Spread to rate on owner-occupier P&I loans
Changes in business lending standards have been mixed over the past year. Data from APRA’s Credit Conditions and Lending Standards Survey indicate some loosening in lending conditions for residential development, following a period of considerable tightening in this area. For general large business lending, the survey indicates ongoing compression in margins and increases in loan terms. Banks report some caution in lending for retail commercial property. Small business lending has grown more slowly than lending to large businesses over the past year – this may reflect some tightening in lending standards for these loans7.
Financial stress
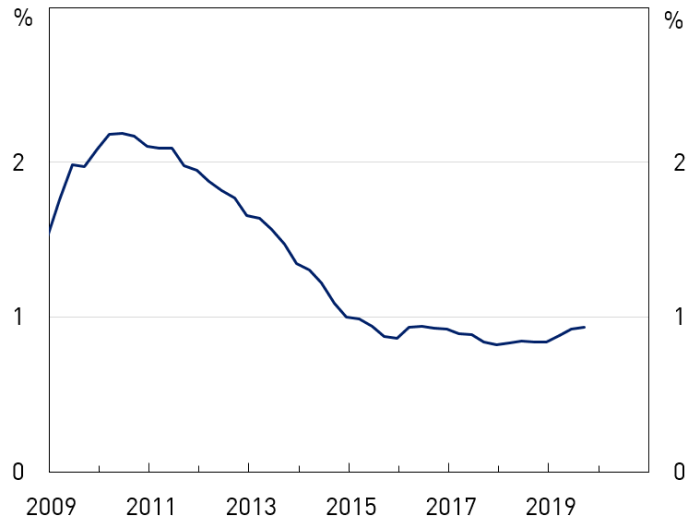
The aggregate non-performing loan ratio for banks in Australia is low. Consistent with this, major banks’ bad debt charges were at very low levels in their recent profit results. When reviewing by borrower type, the non-performing loan ratio for business lending has risen slightly over the past quarter, but remains close to its post-GFC low. The share of loans to households that are non-performing has been increasing gradually over the past five years. The housing loans arrears rate is now around 1 per cent, having risen from around 0.6 per cent in 2014.
Aggregate non-performing loans
Consolidated global operations, share of lending
Non-performing loans by lending type
Domestic operations, share of lending

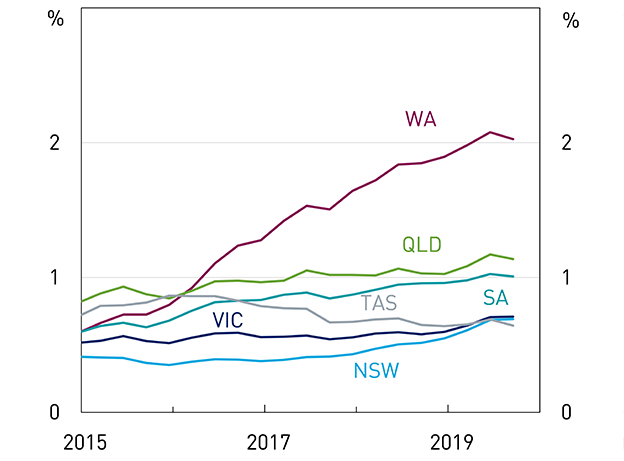
Around one-half of the rise in the national housing arrears rate since 2014 is due to rising arrears in Western Australia. The arrears rate in this state has risen steadily since 2014, due to rising unemployment and the fall in housing prices discussed above. Arrears rates have also risen steadily in Queensland and South Australia over this period. Over recent years, arrears rates have also been rising in New South Wales and Victoria, but from a low base. APRA continues to closely monitor state-level housing arrears.
Non-performing housing loans by state
Share of lending by state
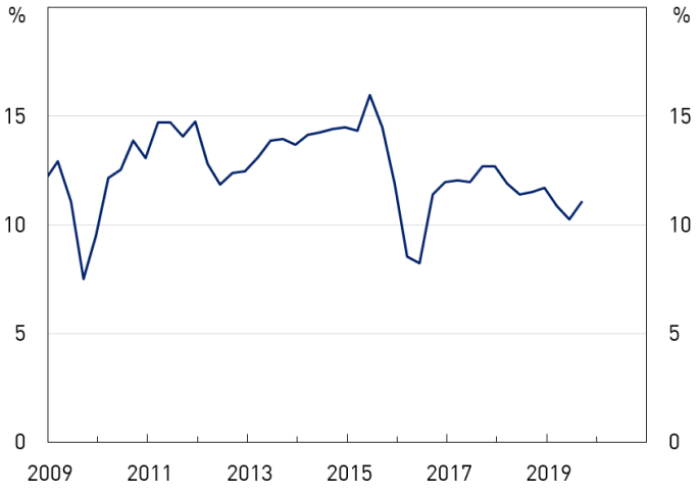
Profits provide a buffer that protects the banking system from negative shocks. The profitability of the banking system declined slightly over the past year, but remains relatively high by comparison to banking systems in many other advanced countries. This lower profitability over the past year has been driven by slow credit growth, lower interest rates, and costs and provisions associated with the operational failures and misconduct.
The low interest rate environment is likely to lower banking system profitability over coming years, as effective limits on minimum deposit rates lead to lower net interest income. A separate but important risk to banks is a search-for-yield dynamic caused by low rates. This is a dynamic under which banks increase the riskiness of their lending in order to target rates of return achieved in higher interest rate environments. This is more likely to occur at banks that do not adjust their return-on-equity targets.
Banking system return on equity
Semi annual average
Other considerations
Current levels of banking system resilience and the broader operating environment are also important when assessing the overall level of systemic risk and setting the countercyclical capital buffer.
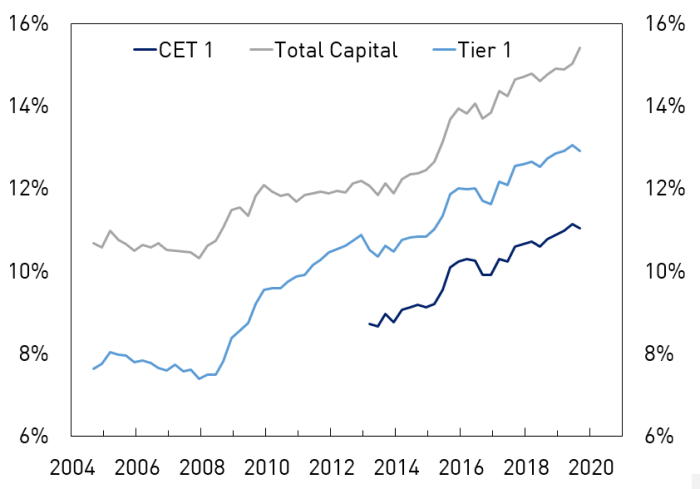
In aggregate, and for almost all banks, capital ratios are now at or above the benchmark levels APRA set in response to the recommendations of the 2014 Financial System Inquiry. Large banks have also begun to increase their Tier 2 capital, in order to satisfy the Loss-Absorbing Capacity requirements set out by APRA earlier in 20198. Taken together this suggests the Australian banking system has significant capacity to absorb large economic and financial shocks.
Aggregate capital ratios - ADI sector
Over recent years, large banks in Australia have experienced significant costs and expenses due to misconduct and poor management of operational risk. The Royal Commission into Misconduct in the Banking, Superannuation and Financial Services Industry, which was finalised in early 2019, was a major catalyst for the recognition of these issues. It brought to light a range of misconduct and other issues, and banks were forced to begin large customer remediation programs. In a number of cases, financial regulators have also imposed large fines on banks and forced them to undertake significant remediation. While it is entirely appropriate for financial costs and penalties to be imposed in these cases, this heightened operational risk environment needs to be considered as part of the broad systemic risk environment. APRA has taken action to partly offset this contribution to systemic risk, by forcing large banks to hold additional capital against operational risk.
The broader economic environment is also a relevant consideration. Over the past year, the growth rate of the Australian economy has slowed substantially. A significant part of this slowing has been due to weaker-than-expected household consumption. The national unemployment rate has also risen, but only to a small degree. A number of forecasters are predicting a gradual increase in the growth of economic activity over 2020, underpinned by recent stimulus and a recovery in the housing market. Recent reductions in the cash rate are expected to support this outcome.
Many of the risks to this economic outlook, and potential triggers for systemic risk events, are global. Trade and technology tensions between the United States and China have continued over the past year, creating an uncertain global business environment. Political tensions continue in Hong Kong, and appear to have led to a sharp contraction in the economy of this financial hub. Brexit remains unresolved.
Taken together, current levels of banking system resilience and the broader operating environment support APRA’s decision to maintain the countercyclical capital buffer at zero.
Table of indicators

* Six-month-ended annualised growth; expressed in per cent
** Expressed in percentage points
Footnotes:
3 See APRA, Information Paper: Countercyclical capital buffer, January 2019.
4 The long-run trend is calculated using a one sided Hodrick-Prescott filter, a tool used in macroeconomics to establish the trend of a variable over time. For more information see Basel Committee, Guidance for national authorities operating the countercyclical capital buffer, December 2010.
5 Areas in this work are defined by Level 3 Statistical Areas, a decomposition of Australia developed by the Australian Bureau of Statistics. There are around 350 Level three Statistical Areas, and they generally have populations between 30,000 and 130,000.
6 For further discussion of this program of work, see APRA, Information Paper: Prudential measures for residential mortgage lending, January 2019.
7 For further discussion, see RBA, Financial Stability Review, Chapter 4: Regulatory Developments, October 2019.
8 See APRA, Media Release: APRA responds to submissions on plans to boost the loss-absorbing capacity of ADIs to support orderly resolution, July 2019.
Note on submissions
It is APRA's policy to publish all submissions on the APRA website unless the respondent specifically tells APRA in writing that all or part of the submission is to remain confidential. An automatically generated confidentiality statement in an email does not satisfy this purpose. If you would like only part of your submission to be confidential, you should provide this information marked as 'confidential' in a separate attachment.
Submissions may be the subject of a request for access made under the Freedom of Information Act 1982 (FOIA). APRA will determine such requests, if any, in accordance with the provisions of the FOIA. Information in the submission about any APRA-regulated entity that is not in the public domain and that is identified as confidential will be protected by section 56 of the Australian Prudential Regulation Authority Act 1998 and will therefore be exempt from production under the FOIA.