Highlights
Industry overview
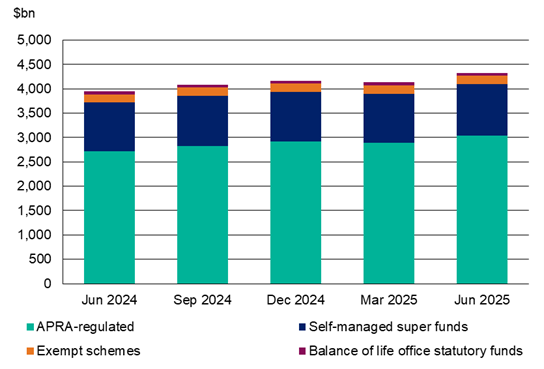
Total superannuation assets increased by 4.8 per cent over the quarter to $4.3 trillion as at June 2025 (Chart 1), of which $3.0 trillion was in APRA-regulated funds. Total superannuation asset growth was 9.8 per cent over the year to June 2025.
Chart 1: Assets of superannuation entities
Entities with more than 6 members
The comments below relate to superannuation entities with more than six members.
Contributions, benefit transfers and benefit payments
Total contributions were $64.7 billion for the quarter and reached $210.2 billion for the year ending June 2025, an increase of 14.1 per cent from the previous year. Employer contributions were $42.4 billion for the quarter and $151.1 billion for the year ending June 2025, 10.1 per cent higher compared to the previous year. The annual growth included the effect of an increase in the super guarantee contribution rate from 11.0 per cent to 11.5 per cent starting July 2024. Member contributions were $22.3 billion for the quarter and $59.1 billion for the year ending June 2025, 25.8 per cent higher than the previous year. The increase was driven by growth in personal contributions.
Benefit payments totalled $132.5 billion for the year ending June 2025, a 12.8 per cent increase from the previous year. The increase was attributable to a 14.3 per cent increase in lump sum payments and 11.0 per cent increase in pension payments over the year ending June 2025. Total benefit payments for the quarter of $36.9 billion comprised $20.1 billion of lump sum benefit payments and $16.7 billion of pension payments (Chart 2).
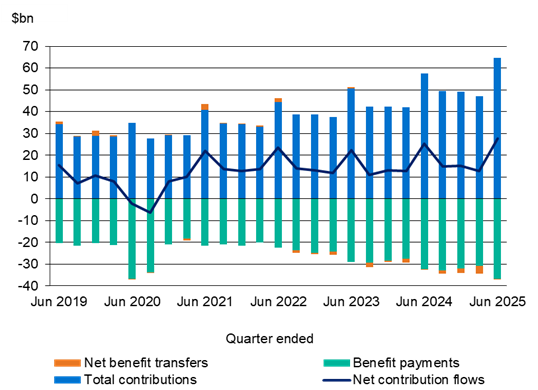
Net contribution flows (contributions plus net benefit transfers, less benefit payments) were $27.8 billion in the quarter (Chart 3). Net contribution flows for the 12 months to June 2025 increased by 13.8 per cent to $70.5 billion.
Chart 2: Benefit Payments
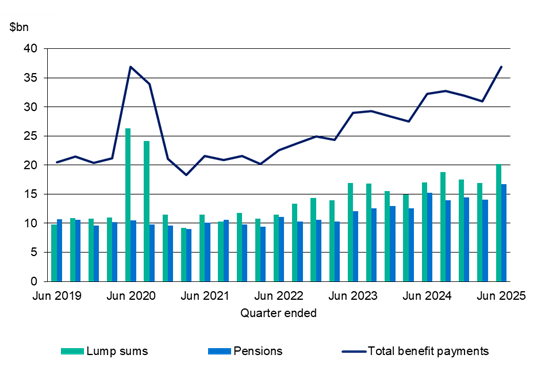
Chart 3: Net contribution flows
Financial performance
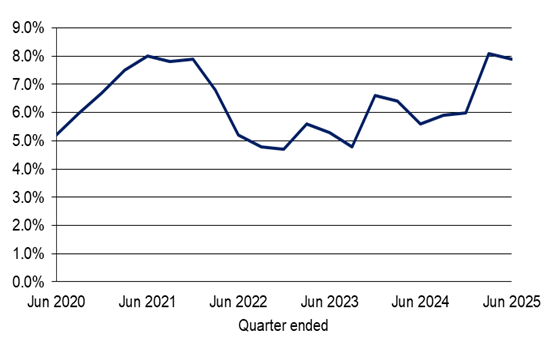
The five-year annualised rate of return (ROR) to June 2025 was 7.9 per cent (Chart 4). The ROR for the year ending June 2025 was 10.2 per cent.
Chart 4: Five-year annualised rate of return