Comprehensive Product Performance Package - Insights Paper 2025
Foreword
The release of the 2025 Comprehensive Product Performance Package (CPPP) continues APRA’s commitment to provide all stakeholders with a clear, comparative view of how products are performing across the industry. In doing so, it enables trustees to understand the performance of their products relative to the industry through a comprehensive set of performance metrics including their Performance Test (PT) assessment outcomes.
Since the commencement of the legislated PT in 2021 we have seen the level of underperformance abating across products subject to the PT, with the number of members in failing products reducing from approximately 1 million to 8,500 members this year. Whilst this represents a significant improvement, there are still members in products that are underperforming – particularly among choice product offerings.
Product performance plays a vital role in shaping the outcomes that matter to members, with any exposure to underperforming products having a material impact on their retirement. Trustees must act in their members’ best financial interests in both the design and provision of products and services to members. Prudential Standard SPS 515 Strategic Planning and Member Outcomes (‘SPS 515’) requires trustees to embed a comprehensive approach for assessing the delivery of member outcomes and improve these outcomes when targets are not met. Trustees for poorly performing products must take credible and timely action to rectify poor performance.
APRA expects trustees to embed the comprehensive insights offered by the CPPP (including how their products performed under the legislated PT) into the actions taken under SPS 515. APRA will continue to review outcomes assessments and business performance reviews to ensure trustees embed the CPPP’s insights into their review of business operations. Supervisory attention will be directed where trustee practices do not meet APRA’s expectations. APRA’s supervisory intensity is heightened where there is widespread poor performance across a trustee’s product offering, as this may be indicative of weaknesses in governance arrangements and business operations.
Dashboard
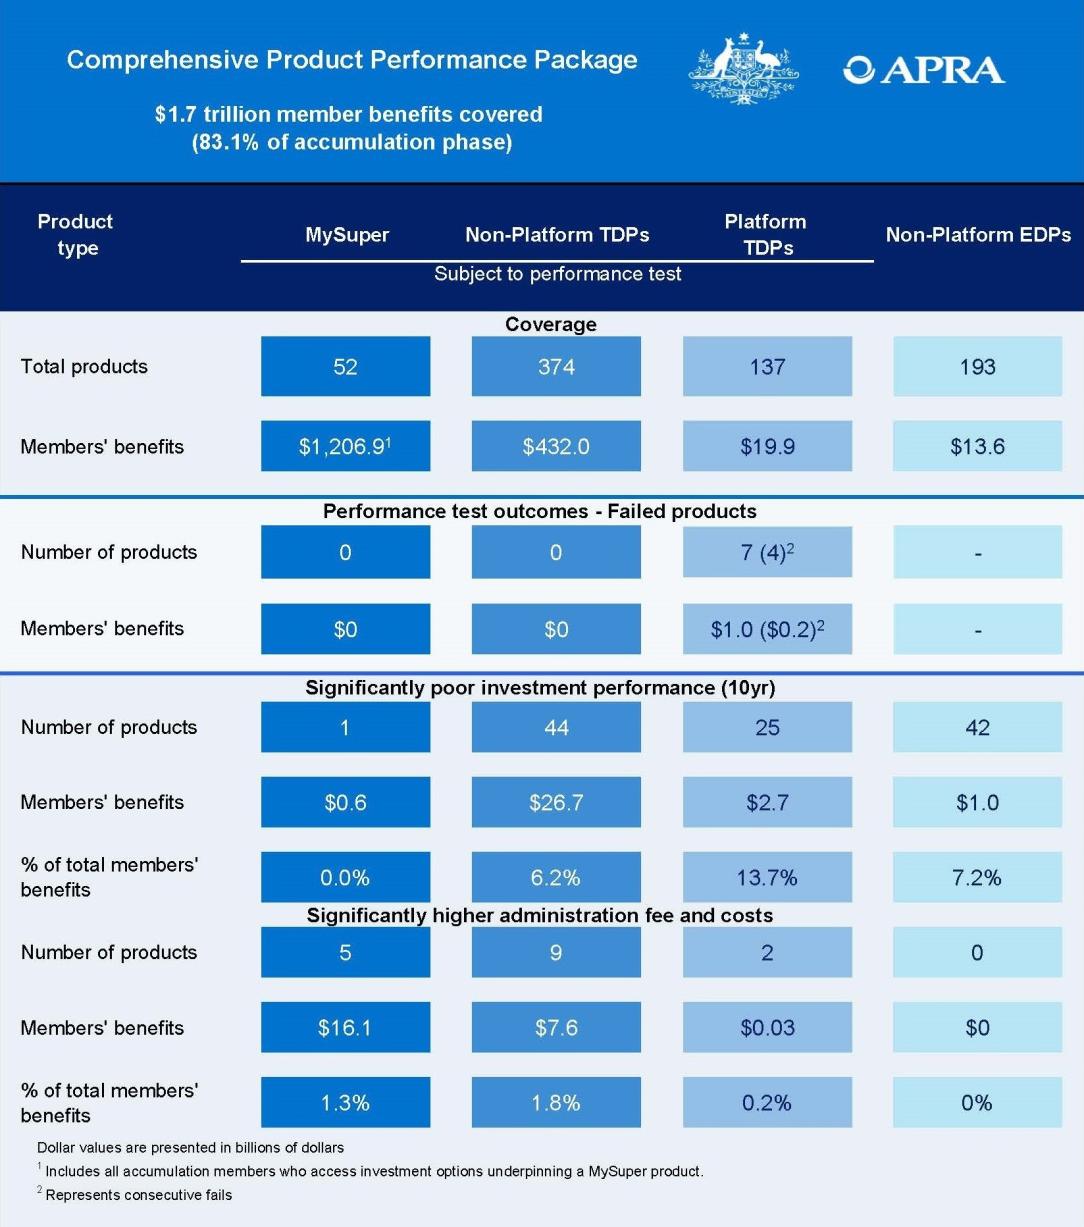
View an accessible version of the CPPP dashboard
1. Introduction
In 2025, the retirement savings of members in superannuation funds increased by close to $400 billion, with the retirement savings of all Australians now more than $4.3 trillion. APRA-regulated superannuation funds now hold $2.7 trillion in member benefits with $2.0 trillion in accumulation products and the remaining member benefits in retirement products.
The 2025 CPPP focuses on multi-sector accumulation products offered through APRA-regulated funds. The 2025 CPPP comprises:
- this insights paper;
- statistical publications in excel and csv formats;
- an interactive online tool that can be accessed (via the APRA website); and
- an updated methodology paper.
In 2026, APRA will incorporate account-based retirement products in the CPPP, further increasing transparency of superannuation product offerings.
Key Terms
Product Types:
- MySuper Products: Default products with a single diversified investment strategy that complies with legislated requirements around fees and the provision of member benefits.
- Lifecycle MySuper Products: MySuper Products with an investment strategy that comprises several different identifiable asset allocations that adjust members’ exposure to investment risk as they age.
- Choice Products: Investment offerings that enable members to be more actively involved with how their superannuation savings are invested.
How are the products managed?
- Trustee Directed Products (TDPs): Diversified investment offerings where the trustee or a connected entity controls the investment management and/or sets the strategic asset allocation for the product.
- Externally Directed Products (EDPs): Diversified investment offerings where the trustee or a connected entity has no control over the investment management and does not set the strategic asset allocation.
How are the products accessed?
- Platform products: Product structures that allow members to create bespoke portfolios by investing in a range of investment options. In most cases, this occurs through the assistance of a financial adviser.
- Non-platform products: Standalone investment offerings that have varying risk profiles or growth/defensive allocations (e.g. growth, balanced, conservative, etc.) that allow members to choose investment offerings that better reflect their risk appetite.
- Investment pathway: The unique combination of superannuation product, investment menu and investment option, used to identify how members access investment options.
Product Coverage
The CPPP covers accumulation multi-sector products offered by APRA-regulated funds and assesses these products using both the outcomes of the PT and additional performance measures focused on investments, and fees and costs. The CPPP does not currently cover any retirement products, single sector products, platform EDPs or defined benefit products. In 2026, APRA will look to incorporate account-based pension retirement products in the CPPP.
Collectively, the products covered in the CPPP capture 83 per cent of member benefits. The CPPP aims to highlight underperformance in key areas to ensure that members receive high-quality outcomes for their retirement.
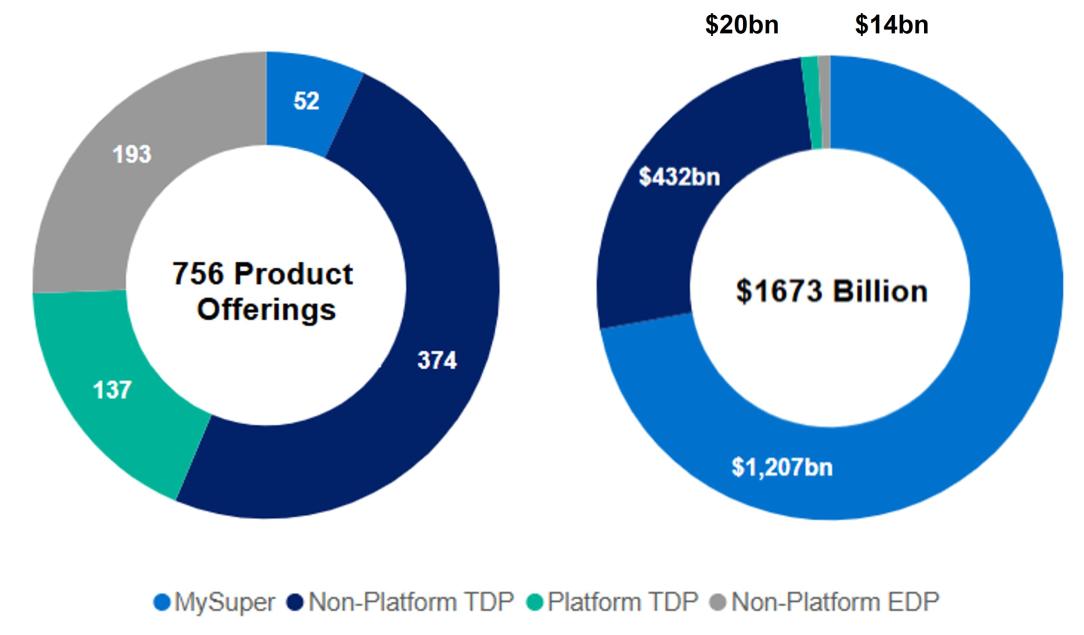
In 2025, 756 product offerings are covered: 52 MySuper products, 137 platform TDPs, 374 non-platform TDPs and 193 non-platform EDPs. These products represent over $1.6 trillion in member retirement savings. While MySuper products only represent a small number of overall product offerings (6.9 per cent) they hold more than $1.2 trillion in member retirement savings (Figure 1).
Figure 1: 2025 CPPP product type breakdown1
2. Performance Test
What is the Performance Test?
The PT is designed to protect Australians’ retirement savings from underperforming products by holding trustees accountable for the outcomes they deliver through increased transparency and significant consequences for continued underperformance. The PT has been in place since 2021 as prescribed in the Superannuation Industry (Supervision) Regulations 1994, with APRA responsible for administering the test.
The PT comprises two components:
- an investment performance component measures the implementation of an investment product’s strategy by comparing the returns of the product to a benchmark derived from the product’s Strategic Asset Allocations (SAA); and
- a fee and costs component measures how the administration fees and costs of a product compares to peer products through a comparison fee benchmark. This benchmark is termed the Benchmark Representative Administration Fees and Expenses (BRAFE) and is the median fee and cost value for the relevant product type.
A product fails the PT if its assessment value (the combination of the two components) is below a threshold of minus 0.50 percentage points per annum.
The PT has several legislated consequences for failure. Members in a product that fails the PT must be informed of this fact in writing, while products that fail the test for two consecutive years must be closed to new members.
Performance Test fails
The number of products failing the PT decreased in 2025
Across the 563 product offerings tested in 2025, 7 failed the PT in 2025 compared to the 37 that failed in 2024.2 As with 2024, all failed products were platform TDPs with 3 first time failures and 4 that have failed for at least two consecutive years. These products with consecutive fails can no longer be offered to new members and have already seen a significant decline in both member accounts and member assets over the past 12 months. No MySuper products or non-platform TDPs failed in 2025.
Three trustees are responsible for this year’s 7 failed products:
- N.M. Superannuation Proprietary Limited had four failed products (including three consecutive failed products);
- I.O.O.F. Investment Management Limited had one failed product (consecutive failed product); and
- Bendigo Superannuation Proprietary Limited had two failed products (first time failed products).
SPS 515 requires trustees to embed a comprehensive approach for assessing the delivery of member outcomes and improve these outcomes when targets are not met through credible and timely action to rectify poor performance.
Figure 2: Performance Test Metric distribution
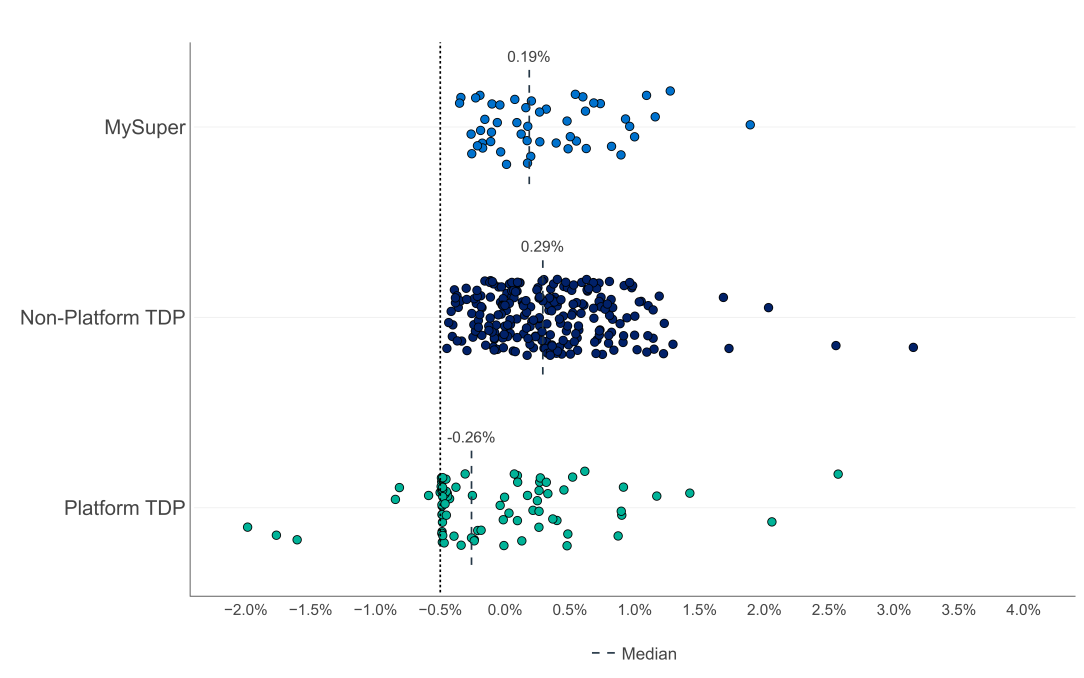
A small number of platform trustee-directed products passed the performance test in part due to trustee’s determining to apply rebates to members. While this does benefit members, APRA will engage with relevant trustees to reinforce the expectation there is an enduring performance improvement for members.
Observations relating to the individual PT components
Underperformance in investment strategy implementation continues to be the main reason for products failing
Consistent with previous years, the investment component of the PT was the primary driver of fails. For 6 out of 7 failed products (86 per cent) the investment component was less than the PT threshold of minus 0.50 percentage points per annum.
Median investment performance relative to benchmark across the products in the 2025 PT has:
- remained positive for MySuper products at 0.24 per cent per annum;
- remained positive for non-platform TDPs at 0.35 per cent per annum; and
- remained negative for platform TDPs at minus 0.22 per cent per annum. However, it is better than in 2024, which had a median of minus 0.32 per cent.
When looking at the fees and costs component of the PT, of the products that failed, 5 products failed due to a combination of high administration fees and costs and relatively poor investment strategy implementation.
The industry has seen a reduction in the fees and costs for members with the median administration fees and costs (as measured by the BRAFE) lower across all product types in the 2025. The reduction over the year was:
- 2.3 basis points for MySuper products to 0.2482%;
- 1.9 basis points for non-platform TDPs to 0.2444%; and
- 10.2 basis points for platform TDPs to 0.4675%.
3. Additional Performance Measures
How the APRA CPPP assesses investment performance
When considering performance in the context of investment returns for the CPPP, APRA assesses broader aspects of investment management through comparing returns to:
- a Simple Reference Portfolio (SRP), to measure the value-add of asset class decisions against a simple, low-cost portfolio; and
- Returns relative to peers (based on underlying growth asset allocations), to compare the performance of products to similar products on a risk-adjusted basis.
To get a holistic view of a product’s investment performance, APRA assesses products in this paper using the CPPP metric, which is a combination of the metrics outlined above and the investment component of the PT over a 10-year time horizon.
To help track changes in the performance of products over time and through different market environments, these additional metrics are provided over the time horizons of 3, 5, 7 and 10 years.
Significant underperformance and comparison to 2024
Platform TDPs and non-platform EDPs continue to have the highest level of underperformance
There have been significant improvements in the performance across non-platform EDPs and some improvements across platform TDPs. Despite these improvements, material levels of underperformance persist, concentrated in a small number of trustees: N.M Superannuation with 60 per cent of platform TDPs, and Equity Trustees with 74 per cent of non-platform EDPs (Figure 3). There has been a noticeable increase in underperformance across non-platform TDPs and no material change across MySuper products.
Table 1: Comparison of the CPPP metric from 2024 to 2025 across product types
| Product | Percentage of products underperforming the CPPP metric by 50bps or more | |
|---|---|---|
2025 | 2024 | |
| MySuper | 2.1% | 1.9% |
| Non-platform TDP | 21.0% | 16.4% |
| Platform TDP | 41.0% | 43.9% |
| Non-platform EDP | 35.3% | 47.2% |
Figure 3: Concentration of poor investment performance in trustees using the 2025 CPPP metric
There are higher levels of underperformance when looking at a broad set of investment performance measures
A broader range of underperforming products have been identified using the set of investment performance measures in addition to the PT investment component, with 64 additional products (MySuper, non-platform TDP and platform TDP) determined to be significantly underperforming.
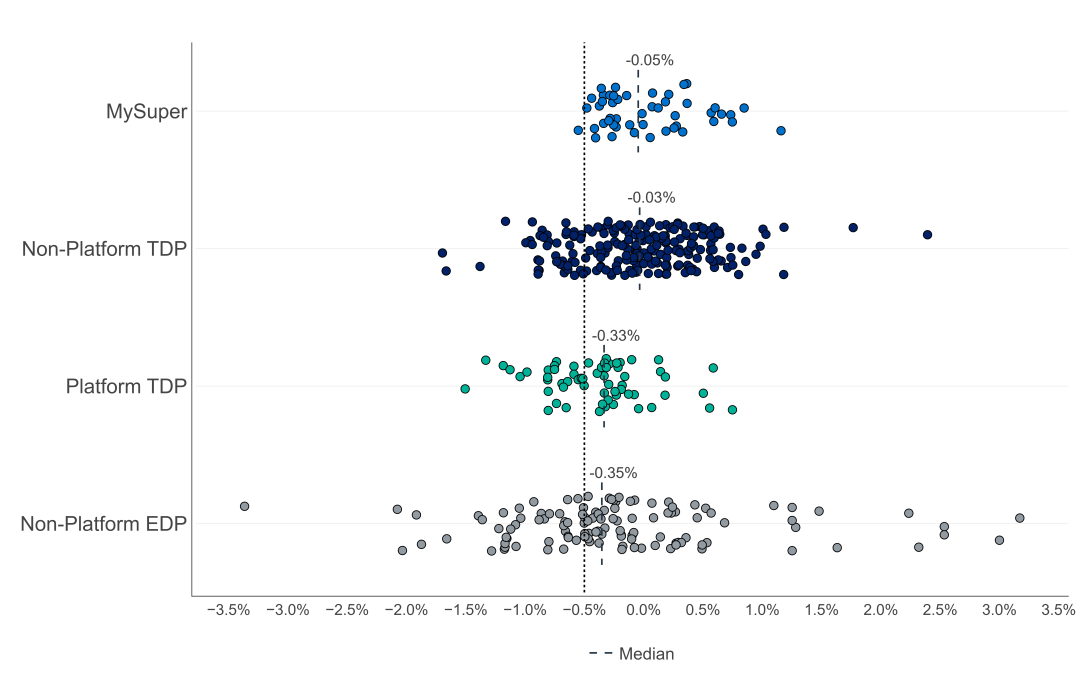
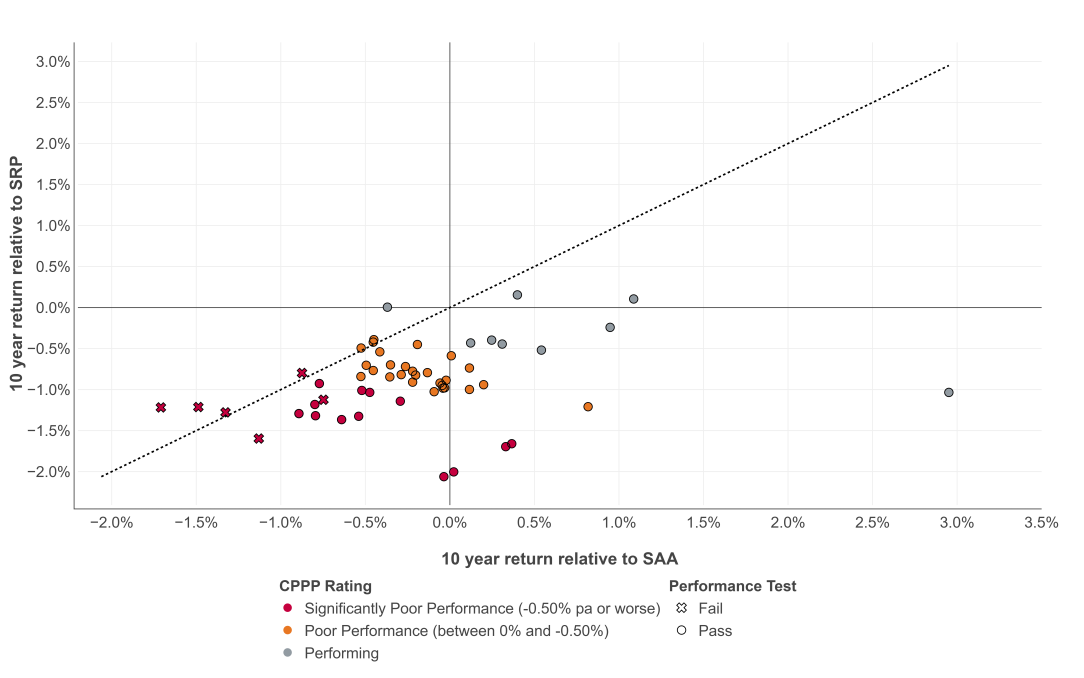
The higher level of identified underperformance is largely driven by asset allocation decisions detracting from returns as compared to an SRP. As outlined in Figures 4 and 5 by products below the dotted line, 93 per cent of TDPs are performing poorer against an SRP compared to the SAA benchmark (investment component of the PT). This trend is broadly consistent with last year where 90 per cent of TDPs performed poorer against the SRP.
Figure 4: 10-year non-platform TDP return to SRP and PT investment component
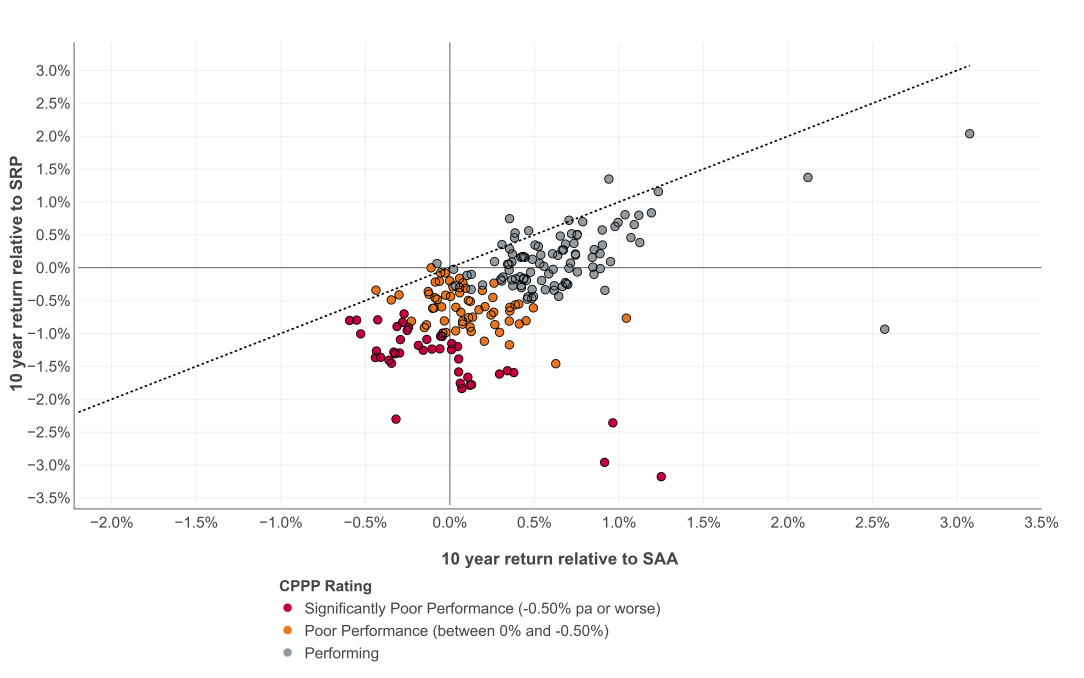
Figure 5: 10-year platform TDP return to SRP and PT investment component
How the APRA CPPP assesses fees and costs
Fees and costs are measured at different member balances of $10,000, $25,000, $50,000, $100,000 and $250,000 in the CPPP for:
- total fees and costs; and
- administration fees and costs.
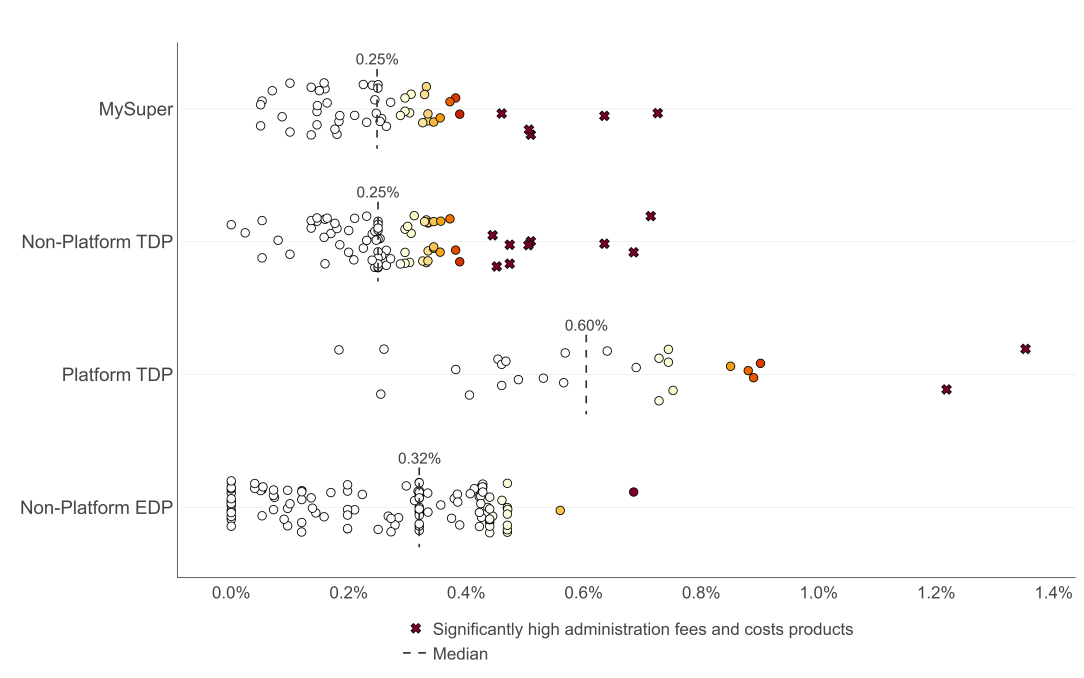
Analysis on fees and costs is based on a $50,000 member account balance and presented at the product level for all products except platform TDPs which is presented at the product and menu level as this is how fees and costs are differentiated across these products.
“Significantly high fees and costs products” are defined as products who have significantly high fees and costs across 3 or more account balances compared to peers.
Overview and comparison to 2024
Non-platform EDPs and platform TDPs have seen a some decrease in administration fees and costs in the past year
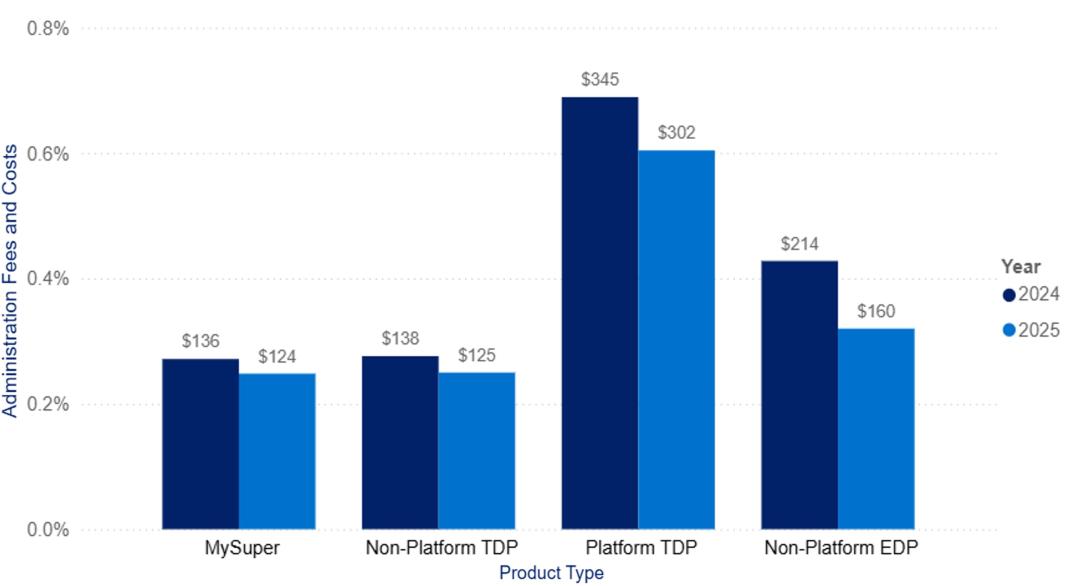
Over the last year, some reduction in fees and costs was observed in non-platform EDPs and platform TDPs (Figure 6). The material decrease in non-platform EDPs fees and costs was driven by a decrease in administration fees and costs for 57 per cent of EDPs. These fees and costs reductions continue the downward trend observed over recent years in MySuper products, platforms and non-platform TDPs.
Figure 6: Median administration fees and costs for a $50,000 account balance
Observations across product types
The flexibility and choice provided through superannuation platforms come at a cost, both in terms of higher administration fees and (generally) poorer investment performance.
MySuper products and non-platform TDPs continue to have very similar fees and costs as expected as they often share the same services, features and fee structures. These products maintain significantly lower fees and costs than non-platform EDPs and platform TDPs. However, when looking across product types, non-platform EDPs are more comparable to their TDPs counterparts than last year, due to fees and costs reductions, but further reductions are required to make them on par.
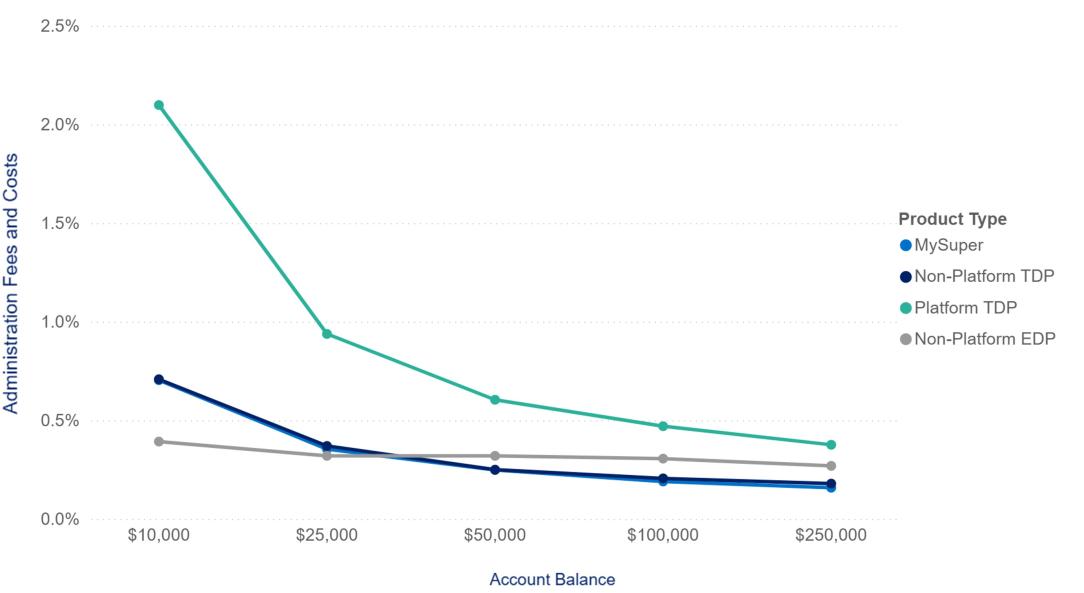
When investing through platforms members are charged higher fees and costs which is generally due to a dollar fee to gain access to a wide variety of bespoke offerings (an access fee). This results in platform TDP administration fees and costs reducing (as a percentage) as member balances increase. As such, members with lower account balances will incur larger fees and costs (as a percentage) investing in platform TDPs than in other product types (Figure 7). While administration fees and costs have reduced in 2025, platform TDPs remain significantly more expensive due to the flexibility they provide.
In accordance with product design and distribution obligations in Part 7.8A of the Corporations Act 2001 and ASIC Regulatory Guide 274, Trustees are expected to target members with appropriate balances and investment needs to take advantage of the flexibility and services these products offer.
Figure 7: Median administration fees and costs across member balances
Significantly high administration fee and costs products
The number of products with significantly high administration fees and costs has reduced
Consistent with reducing administration fees and costs across industry, fewer products (16) have significantly high fees and costs in 2025 with 11 (69 per cent, broadly consistent with 2024) offered by funds with less than $10 billion in assets. Diversa Trustees Limited (5) and Equity Trustees Superannuation Limited (4) account for most high fees and costs products from funds with less than $10 billion in assets. Trustees that are unable to offer competitive fees and costs should consider how they are promoting members’ financial interests and whether these funds should continue to operate independently in the superannuation industry.
Figure 8: Administration fees and costs charged at $50,000 account balance
Footnotes
1 Note that non-platform EDPs are only assessed in the CPPP, not the Performance Test.
2 Of the 37 products that failed in 2024: 32 were wound up over the year, four failed again in 2025 and one did not fail in 2025.