APRA Insight - Issue 1 2016
Residential mortgage underwriting standards
Over the past few years, APRA has intensified its scrutiny of the mortgage lending practices and risk profiles of Australian authorised deposit-taking institutions (ADIs). These actions reflect the importance of housing lending within Australia’s banking system.
Steps taken by APRA have included:
- in 2011, and again in 2014, seeking assurances from the Boards of the larger ADIs that they were actively monitoring their housing lending portfolios and credit standards;
- in 2013, commencing a more detailed collection from the larger ADIs on a range of housing loan risk metrics;
- in 2014, stress-testing the 13 largest ADIs against a significant housing market downturn; and
- also in 2014, issuing a prudential practice guide on sound risk management practices for residential mortgage lending.
Finally, against a backdrop of continued heightened risk due to high house prices, high household debt, low interest rates and subdued income growth, in December 2014 APRA wrote to all ADIs outlining further steps it planned to take to reinforce sound residential mortgage lending practices. These steps — which included the establishment of benchmarks for ADIs on loan serviceability and investor lending portfolio growth — were developed following discussions with other members of the Council of Financial Regulators.
Over the course of 2015 and into 2016, APRA has been closely monitoring ADI lending portfolios, including against these stated benchmarks.
One key element of ADIs’ lending practices is the method by which they assess a customer’s ability to service a loan against a range of potential future circumstances. This assessment of loan serviceability is not merely a legal obligation for lenders; it is also an important, prudent risk management practice.
Loan serviceability methodologies
In making serviceability assessments of borrowers, most ADIs currently use a methodology in which they calculate the borrower’s Net Income Surplus (NIS). Computing NIS is a multi-faceted calculation, with a number of different inputs, and for which the relative importance of each input is not always clear. Assessing the relative prudence of NIS assessments across ADIs can therefore be problematic, as it can be difficult to determine the extent to which one conservative assumption outweighs another less- conservative assumption, and apparent minor differences in methodology can sometimes have a significant impact on the overall outcome.
To assess and compare lending standards across ADIs, one technique used by APRA has been a Hypothetical Borrower Exercise (HBE). In early 2015, APRA asked a number of the larger ADIs to provide their serviceability assessments for four hypothetical mortgage borrowers — two owner-occupiers and two investors — using their policies in place as at 31 December 2014. This allowed APRA to compare the lending decisions of ADIs based on identical borrower characteristics. Importantly, it also allowed APRA to disassemble assessments into their component parts. In May 2015, APRA outlined some results and conclusions from the first HBE.1
To test how lending policies had changed in response to APRA’s scrutiny, APRA ran a second HBE in late 2015, based on the policies ADIs had in place as at 30 September 2015. By asking the same population of ADIs to assess the same four hypothetical borrowers, not only could APRA compare across ADIs, it could also compare the same ADI at two different points in time.
The four charts below relate to the four calculation components for one of the hypothetical borrowers — in this case, a ‘typical’ investor. The blue bars show the results for December 2014, while the red dots show the September 2015 results for the same lender. Each chart is sorted with the most conservative lender for that particular component (as at September 2015) on the left, and the least conservative on the right.
Chart A - Income recognised (less tax and haircuts)
Percentage of gross pre-tax income
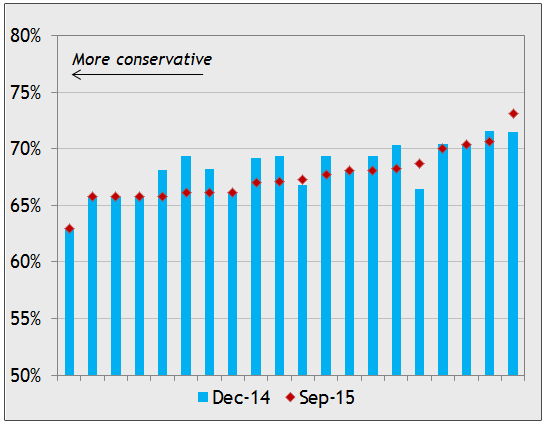
Bars represent individual lender data
Chart B - Minimum living expense assumptions
Percentage of borrower pre-tax salary income
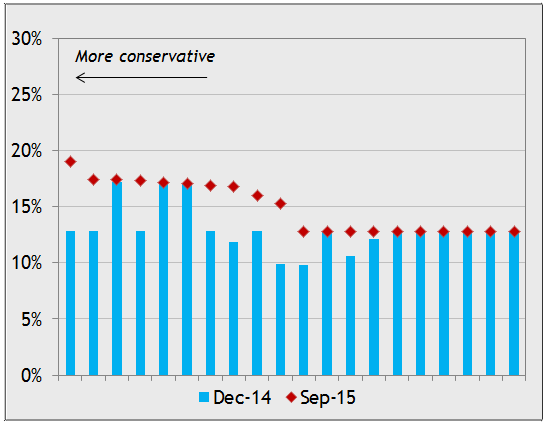
Bars represent individual lender data
Chart C - New mortgage
Interest rate used in serviceability assessment
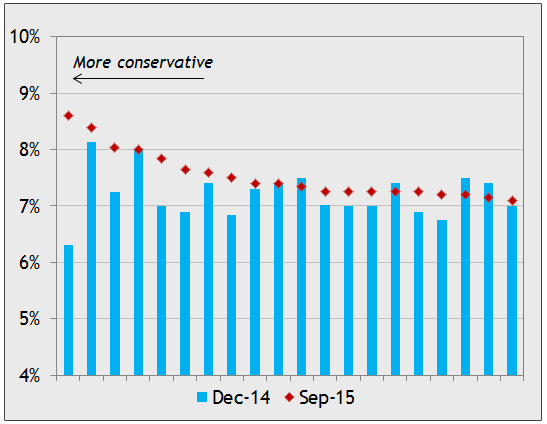
Bars represent individual lender data
Chart D - Existing mortgage
Interest rate used in serviceability assessment
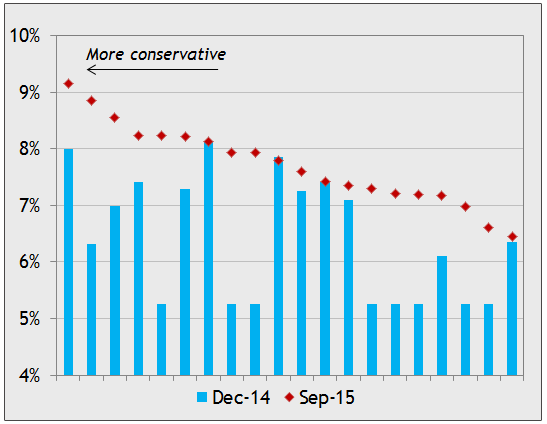
Bars represent individual lender data
The current interest rate on the existing mortgage debt is 5.2%.
Chart A shows income recognised, as a percentage of gross pre-tax income. While the assessment of PAYG salary income has usually remained the same between the two periods, a number of lenders have applied larger haircuts (i.e. discounts) to less stable sources of income such as overtime, bonuses, commissions, investment dividends and rental income.
Chart B shows minimum living expense assumptions as a percentage of pre-tax salary income. Some lenders have made quite large changes to this component of their NIS assessment. This impact has typically arisen from two main sources:
- considering borrower-declared expenses where these are greater than calculated benchmarks; and/or
- scaling living expense assumptions in line with income.
Chart C shows the interest rate used in the serviceability assessment for this new mortgage. Various lenders have increased that rate in response to APRA’s December 2014 letter, in which APRA stated that prudent serviceability policies should incorporate a ‘serviceability buffer of at least 2 per cent above the loan product rate, with a minimum floor assessment rate of 7 per cent.'
Chart D shows the interest rate used in the serviceability assessment for an existing mortgage commitment. Here, the changes are even more dramatic than for Chart C, as at the time of the first HBE a number of ADIs were not using any serviceability buffer on existing debt.
These four components combine to calculate NIS. Whilst there was little overall change in NIS for the lenders that were already relatively conservative in December 2014, lenders that were the least conservative in December 2014 generally reported a significant drop in calculated NIS using their September 2015 policies. These changes had the effect of tightening the spread of calculated NIS from the most to the least conservative ADI. Overall, the maximum loan sizes reported by ADIs for the four hypothetical borrowers declined by, on average, around 12 per cent for investors and 6 per cent for owner-occupiers. (Note that this does not imply actual loan sizes are falling across the board; indeed the average size of loans continues to rise.)
Conclusion
APRA’s HBEs have proven a simple but effective tool for examining the impact of changes to residential mortgage lending policies during 2015.
Overall, debt serviceability assessments now appear to be both more prudent and more consistent across ADIs, relative to December 2014. APRA will continue to engage ADIs on this issue in 2016 to assess whether the observed improvements in sound underwriting practices are maintained. APRA will also be examining the extent to which loans are able to be approved outside an ADI’s own (tightened) policy parameters.
1 Sound lending standards and adequate capital: preconditions for long-term success
Private health insurance industry overview
Introduction
Private health insurance is a key element in the Australian health system. It is the largest single class of insurance in Australia by premium income, providing around 13.4 million people with some form of private health insurance coverage (either hospital or general treatment) in December 2015, through 6.5 million policies. The private health insurance industry in Australia is mature, with most of the insurers having long tenures in the market.
From 1 July 2015, APRA assumed responsibility for the prudential supervision of private insurers from the Private Health Insurance Administration Council. A significant focus for APRA since this transition has been its engagement with the industry, which has included attending and presenting at numerous industry conferences, and a range of meetings with boards and management of private health insurers as well as other industry participants such as actuaries, associations and key service providers. The main aim of this engagement has been to ensure that APRA’s supervisory approach is well understood, as well as to augment APRA’s understanding of industry developments.
Beyond ongoing prudential oversight, APRA’s responsibilities include the registration of new insurers and changes to an insurer’s membership and profit status. Since 1 July 2015, there has been one application to APRA, a change in registration status for Queensland Country Health Fund Ltd to for-profit, approved by APRA, effective from 1 January 2016.
Industry structure and financial position
There are currently 33 private health insurers in Australia, with the top five representing 80 per cent of the market share by total policies. The largest two insurers, Medibank Private Limited and BUPA Australia Pty Limited, have 55 per cent of the market between them. Unlike other insurance industries regulated by APRA, insurers in this industry must specify their membership status and their profit status as part of their registration. Currently there are 23 open and 10 restricted1 funds, and 10 for-profit and 23 not-for-profit funds.
Chart 1: Market share of private health insurers — June 2015
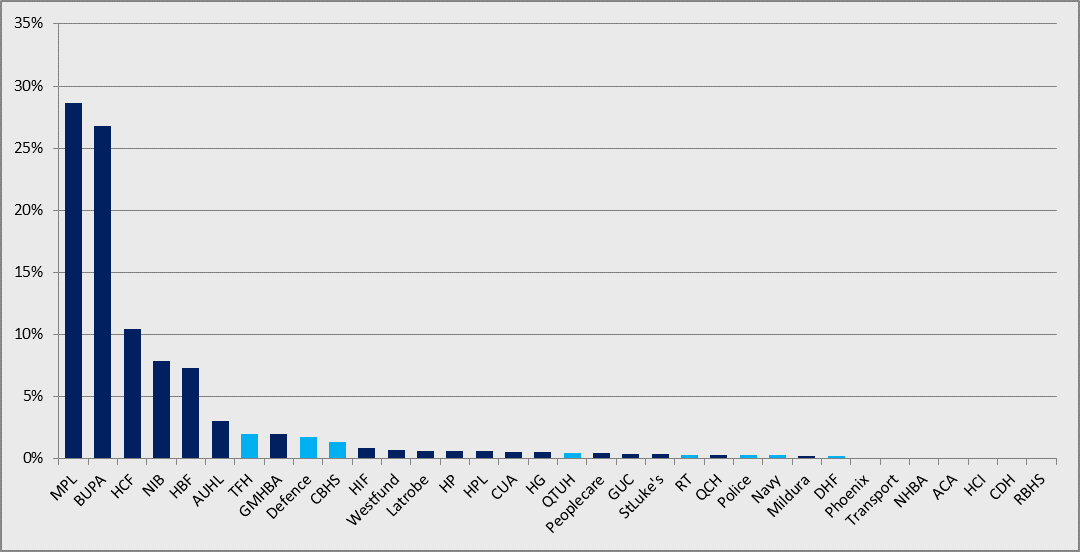
Source: APRA data
Note: Market share with dark blue columns are open insurers while light blue coloured columns represent insurers with a restricted status.
Chart 2: Age and gender distribution of hospital coverage — December 2015
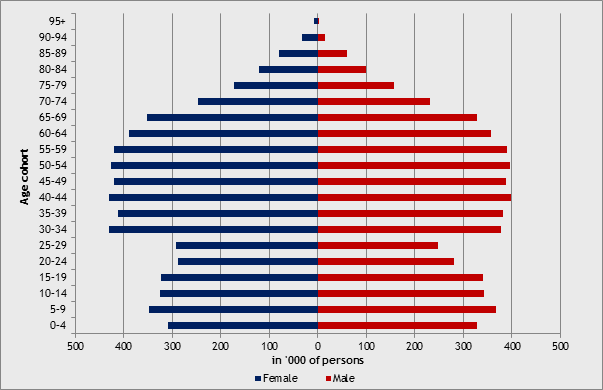
Source: APRA data
The industry has a number of unique characteristics underpinning the special nature of health insurance products:
- a very short tail in claim payments (most claims are paid within three months);
- community rating principle applied to policy pricing;
- government oversight of products and pricing;
- cross-subsidisation of certain groups through risk equalisation; and
- the industry and its viability is sensitive to broader government policy changes or decisions in the health sector.
The main business of any private health insurer is to offer hospital and general treatment policies, with coverage definitions for these policies regulated by the Private Health Insurance Act 2007. Private health insurers are also able to provide goods and services through health-related businesses. These include, for example, overseas and student visitor health cover and insurer-branded optical and dental centres.
The private health insurance industry makes a significant contribution to health funding and the provision of health services to a large proportion of the population. In 2014/15, the industry supported the funding of:
- 4.3 million hospital episodes in private, public and day facilities to the value of $9.3 billion;
- 35 million medical services to the value of $2.1 billion;
- 2.4 million prostheses to the value of $1.9 billion; and
- 86 million general treatment services (the majority of which were dental, optical and physiotherapy) to the value of $4.6 billion.
For the 11.3 million Australians with private health insurance hospital coverage, policies tend to be skewed towards older age cohorts and with slightly more women covered than men. In Chart 2 below, the jump in coverage in the 30-34-year age cohort for both men and women reflects the impact of lifetime health cover loading on premiums.
Financial performance
Health benefits fund revenue grew 6.9 per cent in 2014/15 to $21.3 billion, underpinned by a 6.2 per cent weighted average increase in premiums from 1 April 2014 coupled with an increase in the number of private health insurance policies. From this revenue, the industry paid $18.1 billion in benefits in 2014/15 (an increase of 6.9 per cent from the previous year). The majority of benefit payments were for hospital, medical services and prosthetics (74 per cent) with the balance contributing to the cost of general treatments.
Investment revenue from fund assets and net health-related business revenue contributed only 3 per cent of the total revenue of private health insurers in 2014/15.
Management expenses in 2014/15 were $1.8 billion, an increase of 6.4 per cent from the previous year. As a proportion of revenue, management expenses vary considerably by insurer (see Chart 3), reflecting a number of factors related to individual operations (such as insurer size) or one-off changes in expenses (e.g. replacement of IT systems) in a particular year.
Chart 3: Managerial expenses as a proportion of premium revenue — 2014/15
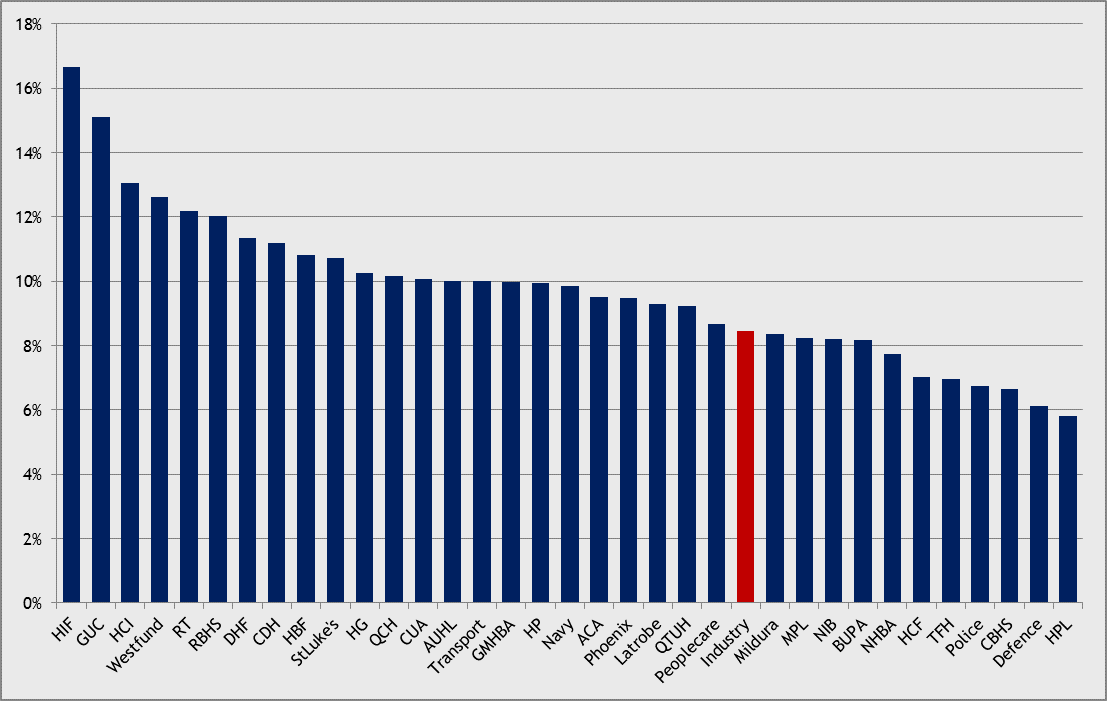
Source: APRA data
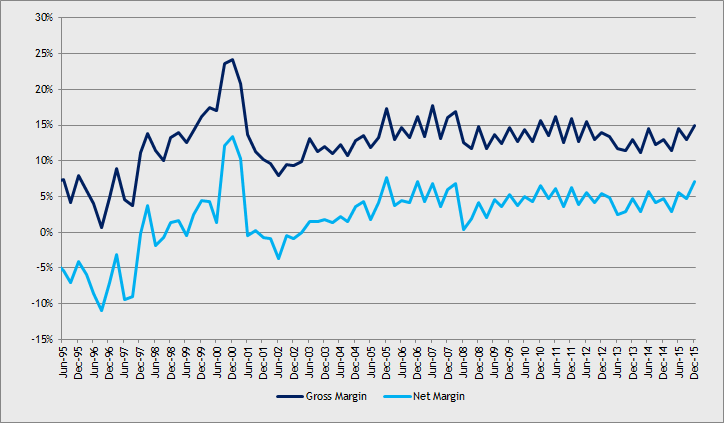
Chart 4: Private health insurance margins — June 1995 to December 2015
Source: APRA data
Note: The gross margin is the difference between total premium revenue and total cost of benefits expressed as a percentage of revenue. Net margin is gross margin less management expenses expressed as a percentage of revenue.
The industry is profitable, with stable profits reflected in stable net margins averaging 4.5 per cent over the last decade (see Chart 4). In 2014/15, the industry generated $1.1 billion in profits after tax, an increase of 6.8 per cent from the previous financial year.
All insurers are required to have a Board-endorsed Capital Management Policy to ensure that each has sufficient capital above the regulatory minimum to absorb a range of adverse events. As at December 2015, the industry held $11.8 billion in total assets covering $4.9 billion in liabilities. This equated to $5.6 billion in assets in excess of minimum capital adequacy requirements.
In terms of assets, the industry has generally been conservative with its investment strategies. In December 2015, $7.6 billion of assets were invested in very low risk cash or interest-bearing assets (65 per cent of total assets). The balance of industry assets were invested in equities, property and ‘other’ assets (see Chart 5).
Chart 5: Private health insurance industry asset distribution — December 2015
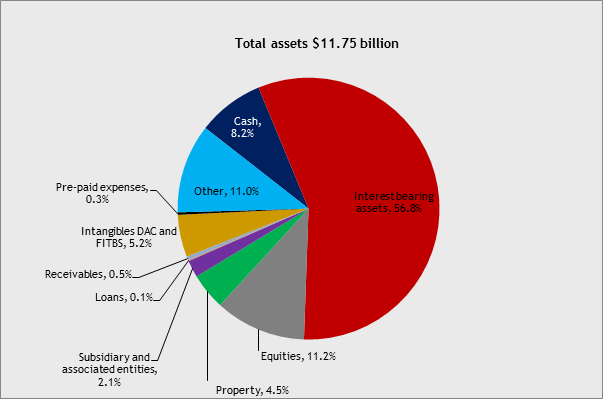
Source: APRA data
Chart 6: Hospital coverage and major policy changes — June 1971 to June 2015
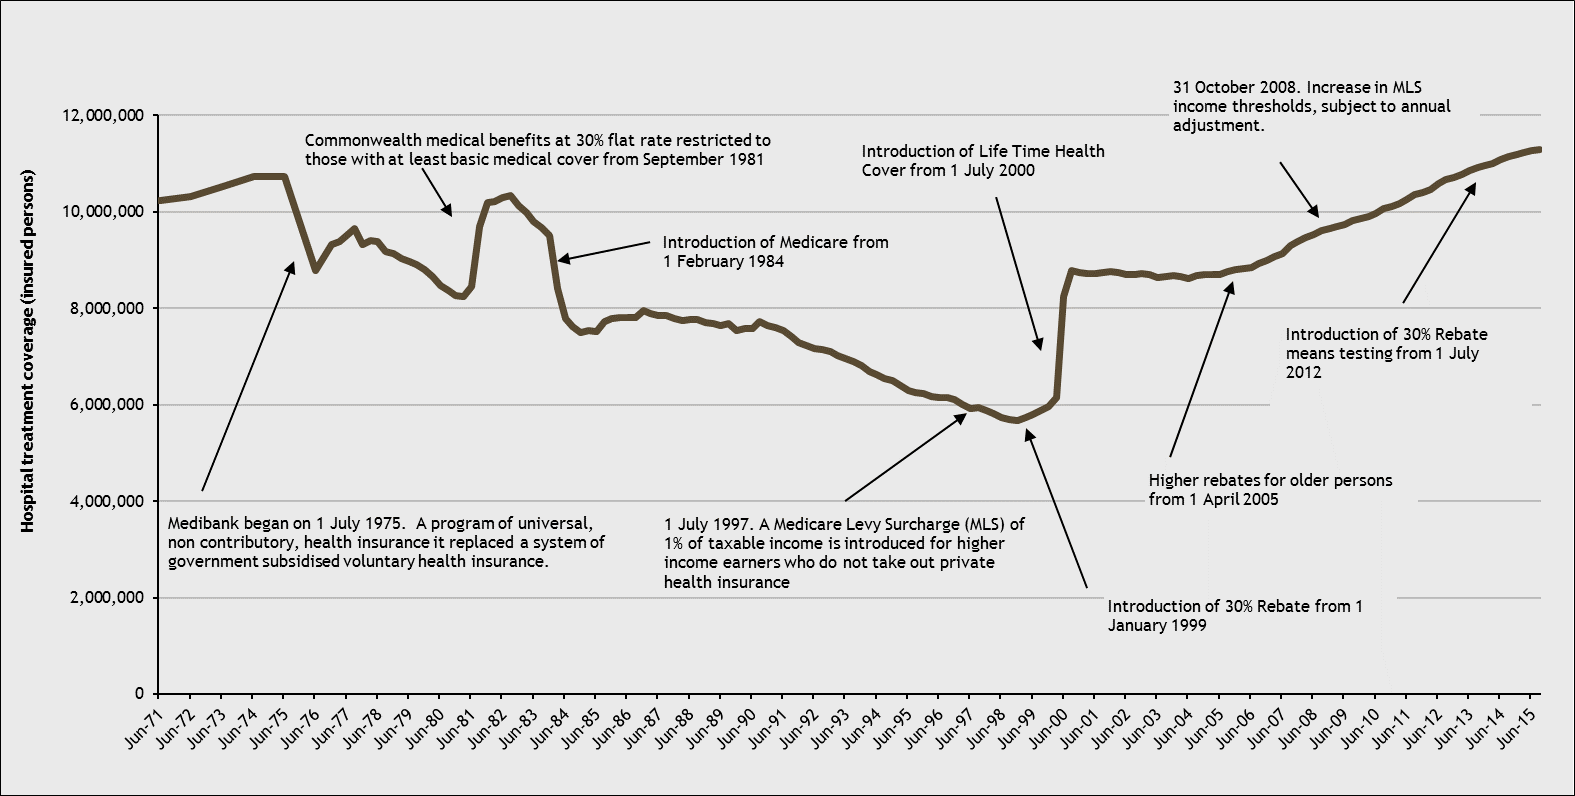
Source: Private Health Insurance Membership Trends, December 2015, APRA.
Industry challenges
Currently, a large proportion of the Australian population has private health insurance hospital coverage, but this was not always the case (see Chart 6). Coverage has been highly influenced by Government policy settings, and the industry has needed to adapt and evolve in response to changes in these settings. That is a challenge that will inevitably continue, given the critical role private health insurance plays within the broader health policy environment.
APRA also needs to monitor changes in the environment for private health insurance so that the regulatory framework continues to be appropriate to the industry structure and dynamics, and be ready to make changes to the framework if needed.
Concluding remarks
The private health insurance industry in Australia is mature, with most insurers having long tenures in the market. The industry is prudentially sound, and in a strong position to meet its obligations, but needs to remain responsive to an ever-changing environment.
1 A restricted access insurer is one whose products are restricted to specific access groups as defined by legislation. These groups are specified in the registration application of the insurer.
The prudential policy outlook
Over the course of 2016, APRA expects to release several policy consultation packages. These will, for the most part, primarily affect authorised deposit-taking institutions (ADIs) and the superannuation industry. The consultations will reflect both domestic policy initiatives - largely driven by the Government’s response to the Financial System Inquiry (FSI) – and, for ADIs, the implementation of internationally-agreed reforms. Insurers will chiefly be impacted by a limited number of cross-industry policy proposals, as well as a review of the role of actuaries.
APRA will also begin engagement with private health insurers during 2016 on the future direction of the prudential framework for their industry. Responsibility for prudential regulation of the private health insurance industry passed to APRA on 1 July 2015 and, consistent with APRA’s undertakings during the transition, no substantive changes will be made to the prudential framework for private health insurers prior to 1 July 2016.
In conducting policy consultations, APRA follows an open and transparent process where public and industry feedback is actively encouraged, and final policy positions are formed after giving due consideration to feedback received.
International developments
The Basel Committee on Banking Supervision (Basel Committee) – the global standard-setter for banking - is committed to finalise in 2016 its remaining post-global financial crisis (GFC) reforms. This includes new standardised approaches to credit risk and operational risk; reducing risk-weight variability when ADIs use internal models for capital adequacy purposes; new capital floors; and the leverage ratio. This follows from the recently-finalised review of capital requirements for trading book exposures.
APRA intends to take a measured approach towards implementing these changes, with suitable adjustments for the Australian context. Whilst these reforms have the potential to affect all ADIs, it is likely the impact will be more noticeable for the largest ADIs. However, given the international work is unlikely to conclude before end 2016, and with many implementation dates yet to be agreed, APRA’s domestic consultation is unlikely to begin before 2017, with local implementation of these reforms following over a number of years.
Derivative markets have also been an area of intense international reform in the post-GFC period. APRA has begun the implementation process in Australia with the recent release of a cross-industry consultation package on margining and risk mitigation standards for non-centrally cleared derivatives;1 a separate (but related) consultation on ADI capital requirements for counterparty credit risk will follow in the near future. These reforms generally only affect the larger APRA-regulated entities in each impacted industry.
Domestic developments
The final report of the FSI includes a number of recommendations that are directly relevant to APRA’s prudential framework. The Government’s response to the FSI, Improving Australia’s Financial System,2 endorsed APRA to implement a number of these recommendations. APRA’s plans in this regard are set out below.
- FSI Recommendation 1: Capital Levels – the FSI highlighted that the stability of the banking sector is of paramount importance to Australia’s economic well-being. With that in mind, the FSI recommended that ADIs have capital ratios that are ‘unquestionably strong’. In settling a final prudential framework to deliver on this recommendation, APRA needs to have regard to the ongoing work of international standard-setters such as the Basel Committee, as well as give thought to how other measure of resilience (for example, with respect to liquidity and funding) can assist in achieving the FSI’s objective. With this in mind, APRA will shortly begin consultation on the implementation of the Net Stable Funding Ratio, which is designed to improve the stability of bank funding profiles.
- FSI Recommendation 2: Narrow mortgage risk weight differences – in July 2015, APRA announced3 an interim measure to increase the average residential mortgage risk weights for ADIs using the Internal Ratings-based (IRB) approach to capital adequacy, from approximately 16 percent to at least 25 percent. This change takes effect from 1 July 2016. Whilst this step materially addresses the FSI recommendation in the short term, APRA will need to consider whether further changes are necessary after the Basel Committee’s broad review of the capital framework is complete later this year.
- FSI Recommendation 3: Loss absorbing and recapitalisation capacity – consistent with the FSI’s recommendation of not moving ahead of international developments, this is an issue that APRA intends to address over the medium term. In the meantime, APRA is monitoring initiatives being taken by overseas regulators in this area, and has begun limited engagement with industry participants on this issue.
- FSI Recommendation 4: Transparent reporting – larger ADIs have begun disclosing ‘internationally comparable’ capital ratios, informed by the methodology developed by APRA for its International capital comparison study (July 2015).4 Although not strictly aligned with the FSI’s recommendation for reporting capital ratios that are ‘transparent against the minimum Basel capital framework’, APRA’s study and the larger ADIs’ reporting have addressed this issue to a large degree. APRA will continue to monitor international comparisons during the course of the year, and then consider whether further work is needed on this recommendation.
- FSI Recommendation 7: Leverage ratio – the Basel Committee is finalising its proposals for the introduction of a leverage ratio as part of its reforms to the Basel capital framework. Leverage ratio disclosure requirements for the largest ADIs have been implemented, but at this stage APRA is likely to follow the international timeframe for the introduction of a minimum leverage ratio requirement (currently scheduled for 2018).
Also of importance to ADIs are revisions to the prudential framework for securitisation. The consultation period on these proposals closed earlier this month, and APRA intends to finalise these revisions in 2016.
In the superannuation industry, APRA will participate where relevant in further Government policy consultation on post-retirement outcomes and governance of superannuation trustees (FSI Recommendations 11 and 13), and initiatives related to the objectives and efficiency of the superannuation system (FSI Recommendations 9 and 10). APRA is also be closely involved in the Government’s consultation on measures to improve the transparency of the superannuation industry, including reforms to the product dashboard requirements for MySuper products and choice investment options.
In general insurance and life insurance, APRA is progressing its review of the role of the Appointed Actuary, and anticipates commencing a public consultation in mid-2016. Across all industry sectors, APRA will continue to refine and clarify its governance requirements, particularly in relation to the important role played by Boards in APRA-regulated entities. APRA will also announce the next steps on our approach to the supervision of conglomerate groups in the near future.
More generally, APRA’s mandate is to balance the objectives of financial safety and efficiency, competition, contestability and competitive neutrality; and to promote financial stability. The FSI noted that regulators should, while remaining consistent with their mandate, increase their focus on competition in the financial system (Recommendation 30). APRA will be looking to provide more information on how it balances financial safety with these other objectives, and more actively seek industry input on these issues so that policy choices are best able to balance these considerations without undermining prudential outcomes.
1https://www.apra.gov.au/media-centre/media-releases/apra-consults-margining-and-risk-mitigation-requirements-non-centrally
2 http://www.treasury.gov.au/PublicationsAndMedia/Publications/2015/Govt-response-to-the-FSI
3 https://www.apra.gov.au/media-centre/media-releases/apra-increases-capital-adequacy-requirements-residential-mortgage/
4 https://www.apra.gov.au/media-centre/media-releases/apra-releases-international-capital-comparison-study
Assessing MySuper products
Introduction
RSE licensees that offer MySuper products are expected to promote the financial interests of the members who hold the product, and to determine annually whether those members are disadvantaged in comparison to members who hold MySuper products within other funds. This assessment should ideally look at a range of factors, including the investment strategy1 (reflecting the return target, level of investment risk and asset allocation); fees and costs; and services such as advice and insurance. A full evaluation of the outcomes for MySuper members is therefore complex. Net returns (a function of both investment performance and fees and costs) relative to the underlying investment objectives for these products is a key aspect of the assessment. However, it is also important to consider whether there is consistency between the return target, level of investment risk and strategic asset allocation for MySuper products.
Any assessment of net investment returns should take a long-term view; an assessment of consistency can be undertaken with a shorter-term perspective. MySuper products have only been available since 1 July 2013, with all default superannuation contributions required to be paid into MySuper products from 1 January 2014. It would therefore be inappropriate to draw conclusions on the relative investment performance of different MySuper products at this early stage. This article therefore focuses on attributes such as return targets, level of investment risk and asset allocation, and how these vary across different MySuper products.
Key terms for MySuper products
Actual return target is the sum of the return target and the annual growth in Consumer Price Index (CPI) as reported by the Australian Bureau of Statistics in catalogue 6401.0 Consumer Price Index, Australia.
Level of investment risk is the estimated number of years in a 20 year period that negative net investment returns will be incurred. Refer to the Standard Risk Measure Guidance Paper For Trustees July 2011 and Standard Risk Measure, Implementation Guidance For Trustees December 2012 issued by the Association of Superannuation Funds of Australia and the Financial Services Council in respect of disclosure of investment risk, including risk labels.
Net return is the net investment return of a representative member minus administration fees, costs and taxes of a representative member and minus advice fees, costs and taxes of a representative member.
Return target represents the mean annualised estimate of the percentage rate of net return that exceeds the growth in the CPI over 10 years.
Risk label is the risk description that corresponds to the level of investment risk:
| Relevant risk label | Level of investment risk |
|---|---|
| Very low | Less than 0.5 |
| Low | 0.5 to less than 1 |
| Low to medium | 1 to less than 2 |
| Medium | 2 to less than 3 |
| Medium to high | 3 to less than 4 |
| High | 4 to less than 6 |
| Very high | 6 or greater |
MySuper products - return targets and level of investment risk
MySuper products share common characteristics and can be readily and consistently compared based on those characteristics.2 Each RSE licensee must set a return target3 for each of their MySuper products and disclose an investment return objective in the product disclosure statement. APRA has 21 months of performance data for most MySuper products, noting that products that were able to be ‘rebadged’ have a longer period of performance history.4 The two figures below compare net returns for a representative member for MySuper products based on the risk label5 and return target respectively.
Figure 1 shows the range of net returns for all MySuper products with the same risk label over different periods – annual returns for the periods ending March, June, September and December 2015 and the annualised return for the full period ending December 2015 (21 months). The median net return for each of these periods is also shown.6 The range of net returns for the annual periods varies more widely than the range of returns for the longer 21-month period, highlighting the importance of taking a longer-term view when considering investment performance. Further, as expected, higher risk products generally show wider variation in net returns for each period and more volatility of returns over different periods compared to lower risk products.
Figure 1 - MySuper net returns by risk label
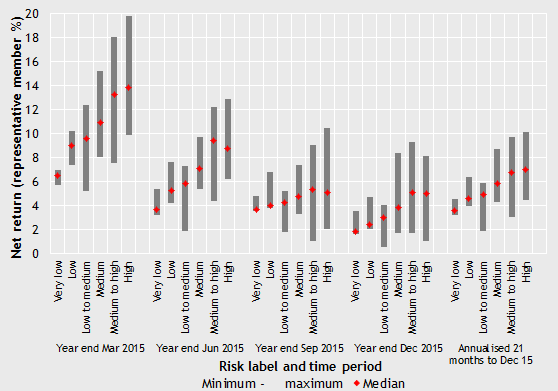
Note: The chart shows the annualised geometric-average net return for each year end and the 21 months ending December 2015.
Data for the one MySuper product with a risk label of 'very high' is not shown. Where a MySuper product has a lifecycle investment strategy, the net return for each lifecycle stage is used.
Source: APRA Statistics
Figure 2 - MySuper net returns by actual return target (21 months ending December 2015)
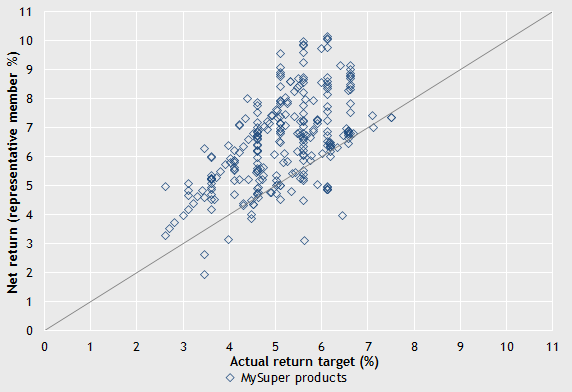
Note: The chart shows the annualised geometric-average net return for the 21 months ending December 2015 and the annualised geometric-average actual return target over the same period (including the CPI over the period of 1.6% per annum).
Where a MySuper product has a lifecycle investment strategy, the net return for each lifecycle stage is shown.
Source: APRA Statistics; ABS 6401.0
Figure 2 shows the annualised net return for each MySuper product over the 21 months to December 2015 relative to the actual return target7 for that product over the same period.8 The net returns for most MySuper products are near or above the relevant actual return target over this period. As noted above, however, it will be some years before reliable conclusions regarding the performance of MySuper products relative to return targets can be drawn.
MySuper products - investment strategy
For each MySuper product, the RSE licensee must determine asset allocation targets and ranges appropriate to its investment objectives and make sufficient information available to allow members to clearly understand the level of risk associated with their product. In general, lower risk MySuper products would be expected to have lower return targets than higher risk MySuper products, and that the range of allocation to cash/fixed income vs equity/property assets for MySuper products with the same risk label would not be unduly wide.
Figure 3 shows the relationship between the return target (expressed as a percentage above CPI) and the level of investment risk. Contrary to what might be expected, the chart shows a wide dispersion of return targets within each risk label, with, for example, many MySuper products labelled medium risk having similar return targets to products labelled high risk.
Figure 3 - Return target by level of investment risk (December 2015)
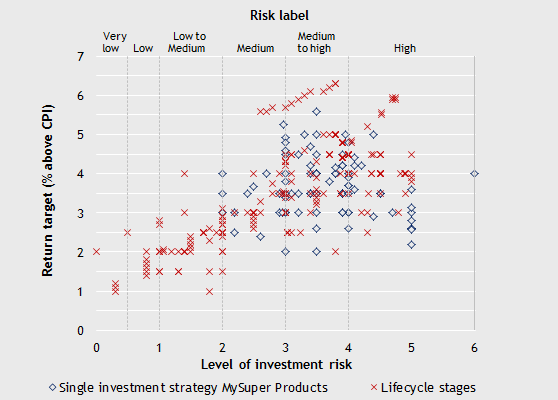
Note: The level of investment risk is the estimated number of negative net investment returns over a 20 year period. The risk label for a level of investment risk of six or higher is 'very high'.
Source: APRA Statistics
Figure 4 - Benchmark strategic asset allocation by risk label (December 2015)
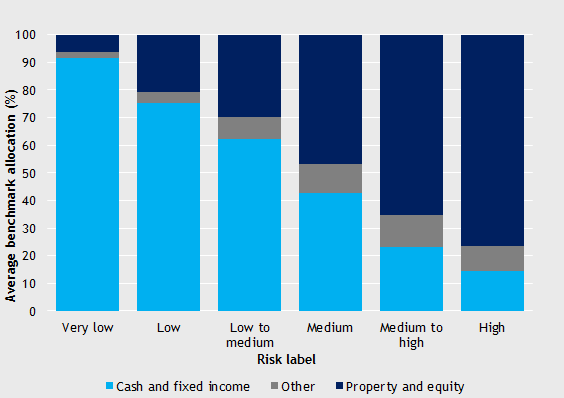
Note: Where the product has a lifecycle investment strategy, the benchmark strategic asset allocation for each lifecycle stage is used. Data for the one MySuper product with a risk label of 'very high' is not shown. Source: APRA Statistics
The average benchmark asset allocations for MySuper products within each risk label is shown in figure 4 and the range9 of benchmark allocation to cash and fixed income for MySuper products within each risk label are shown in figure 5. These figures show that, as expected, as the level of investment risk increases the average allocation towards asset classes generally considered to be higher risk also increases. Within some of the risk labels, however, there is a wide range of allocation to cash and fixed income assets (indicating a correspondingly wide range of allocation to equity/property assets) as shown in figure 5.
While some of this variation may be explained by defensive assets classed within ‘other’, these figures suggest that there is much wider variation in the asset allocations and return targets for MySuper products by risk label than would be expected.
Figure 5 – Benchmark strategic allocation to cash and fixed income by risk label (December 2015)
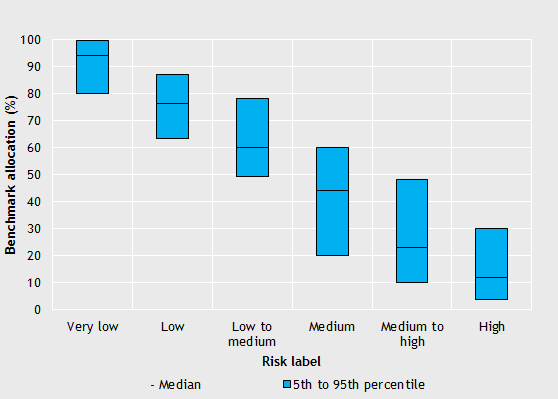
Note: Each shaded box on this chart shows the range of MySuper products’ benchmark allocation to cash and fixed income between the 5th and 95th percentiles (the top and bottom five per cent are excluded from the range). The median is shown by the line in the box.
Where the product has a lifecycle investment strategy, the benchmark allocation for each lifecycle stage is used. Data for the one MySuper product with a risk label of 'very high' is not shown.
Source: APRA Statistics
Conclusion
RSE licensees offering MySuper products must determine annually whether the members of those products are disadvantaged in comparison to members of other MySuper products. Consideration of net returns relative to the underlying return target for these products will inevitably be one aspect of this assessment, however a somewhat longer-time-series of data is needed before meaningful conclusions in relation to performance in this regard can be drawn. Looking at the data to date, the relationship between the return target, level of investment risk and asset allocation of the MySuper products is less consistent than expected. APRA will continue to discuss with RSE licensees their approach to setting their return targets, level of investment risk and asset allocation in order to gain further insights into the apparent wide variations that are evident for products stated as having similar levels of risk.
1 The RSE licensee may adopt a single diversified investment strategy, or a lifecycle strategy. A lifecycle investment strategy is one that varies the asset allocation for a beneficiary according to factors such as their age and/or the time remaining to retirement.
2 Comparing actual net returns against the return target allows comparisons between options or products, but other trustee determined measures for performance are also important to consider. Throughout this paper, where a lifecycle investment strategy is used, the data for each lifecycle stage is shown. An RSE Licensee would be expected to monitor the risk and return measures of each stage of the lifecycle strategy. However assessing these products as a whole involves additional complexities (including the measurement timeframe; benchmarks; and measuring the performance for the glide path).
3 See key terms for the definition of return target.
4 Some RSE licensees rebadged an existing default investment option as the MySuper product. There may be a longer performance period for that predecessor product (where predecessor product has the meaning given in regulation 7.9.07N of the Corporations Regulations). In order to illustrate the net returns by risk label and by actual return target across the industry, the longest period for which most MySuper products and lifecycle stages have investment performance data is used (21 months from 1 April 2014 to 31 December 2015). This captures 113 MySuper products (including 26 MySuper products with 184 lifecycle stages). Three MySuper products with 22 lifecycle stages and six additional lifecycle stages where data was not available for the entire 21-month period are excluded.
5 See key terms for the definition of level of investment risk and risk label.
6 The median is shown as the red diamond on the chart.
7 See key terms for the definition of actual target.
8 Comparing actual net returns against the return target allows comparisons between options or products, but other trustee determined measures for performance are also important to consider. Throughout this paper, where a lifecycle investment strategy is used, the net return for each lifecycle stage is shown. An RSE Licensee would be expected to monitor the risk and return measures of each stage of the lifecycle strategy. However assessing these products as a whole involves additional complexities (including the measurement timeframe; benchmarks; and measuring the performance for the glide path).
9 The range for the middle 90 per cent of MySuper products (excluding the top and bottom five per cent) is shown.