1. Executive Summary
As Australia’s prudential regulator, APRA regularly undertakes stress testing to identify and assess emerging risks that may threaten the resilience of the Australian financial system. APRA has conducted the Insurance Climate Vulnerability Assessment (Insurance CVA) stress test to better understand the insurance protection gap for Australian homes, how it may change into the future, and the risks it may pose to Australia’s financial system.
The insurance protection gap
Insurance supports financial system resilience by shifting large financial losses away from individuals and households, to insurers and reinsurers that can absorb those losses more effectively. The extent to which these losses are not covered by insurance is referred to as the home insurance protection gap.1 Home insurance has particular importance to the resilience of Australia’s financial system, as houses are the largest asset class for Australian households and home mortgages are the largest asset class for Australian banks.2
A growing home insurance protection gap can lead to greater uninsured financial losses for households and banks, which can in turn erode financial system resilience. It is increasingly recognised, both locally and globally, that insurance protection gaps pose a challenge for the financial system.3 International experience suggests that recovery is slower, fiscal costs higher, and pressures on financial system resilience intensify when losses are uninsured.4 Home insurance affordability is a key driver of the protection gap5, and could be amplified by climate risks through both increased claims costs from more severe weather perils, and impacts to future economic outcomes such as slower income growth.
Stress testing insurance affordability
APRA worked with Australia’s five largest general insurers to consider how Australia’s home insurance protection gap may evolve between now and 2050 under stress test conditions. The stress test used two global climate scenarios aligned to the Network for Greening the Financial System (NGFS) scenarios. The first scenario sees higher global emissions6 with greater weather peril impacts7, whilst the second scenario focuses on a lower global emissions pathway with greater risks from a delayed and rapid transition to a lower emissions economy.
As with other APRA stress tests, the scenarios used are not forecasts or predictions; instead, they provide an indication of how financial system resilience may be impacted under severe but plausible stress conditions, such as economic shocks, high rates of unemployment, or elevated weather losses.
Key findings
The Insurance CVA stress test found that (Figure 1):
- The home insurance protection gap for households in freestanding properties8 widens under both scenarios, from an estimated one in seven households uninsured today, to one in four households by 2050.9
- The underlying drivers of increasing affordability stress and a widening protection gap differ between the two scenarios. Premium increases due to the rise in expected weather peril losses are the main driver of the widening protection gap in the higher physical risk scenario, with expected national weather losses increasing from less than $7 billion annually in 2024 to over $16 billion10 annually in 2050. In the higher transition risk scenario, the main driver of the widening protection gap is construction cost inflation (which impacts the sum insured): this leads to growth in insurance premiums that outpaces growth in household incomes.
- The home insurance protection gap tends to widen more in regions that already have lower levels of home insurance protection today. These higher protection gap areas are more likely to be in regional or rural Australia, as these areas tend to experience greater exposure to weather perils and lower average incomes both today and in the future.
Figure 1: Key findings from the Insurance CVA stress test

* ‘Households’ refers to households living in existing freestanding properties and excludes strata properties such as units, flats, and apartments.
Consequences of a growing home insurance protection gap
A growing protection gap may impact households, insurers, banks, governments and the financial system through:
- Households: More households would experience uninsured losses as the protection gap widens. Inadequately insured households may face large, unforeseen loss events such as weather peril events, which erodes their wealth and undermines their financial resilience. Unaffordable insurance costs may reduce the number of mortgage borrowers that are able to meet insurance requirements of lenders. These potential outcomes may have spillover effects for the financial system and the broader economy.
- Insurers: Insurers can periodically adjust their premiums to reflect escalating weather risks and manage their financial risk exposure. Where this exacerbates affordability stress in high‑risk communities, it may undermine the insurance industry’s ability to meet societal expectations and create pressure for reforms to the private insurance market. In addition, under a widening protection gap, the number of households unable to afford insurance cover continues to increase, which could constrain growth of the overall home insurance market.
- Banks: A widening protection gap may amplify credit risk for banks in regions with high weather peril risks. Mortgage borrowers that become uninsured will have a higher likelihood of default as they could face large financial losses from severe weather events. Additionally, banks may experience a greater loss in the event of default if housing collateral is damaged or devalued due to weather peril events.
- Governments: A widening protection gap could lead to increased reliance on government support following weather events, as well as calls for public intervention to improve insurance affordability. Both of these could result in higher fiscal costs for governments.
Addressing the home insurance protection gap
Addressing the widening home insurance protection gap is a complex challenge, and a coordinated approach between governments, industry and the community is necessary to effectively reduce the underlying risks and alleviate the impacts of these risks.
- Risk reduction: Reducing the underlying risk from weather perils can make a significant contribution to addressing the insurance protection gap and avoiding the negative consequences borne by households and the financial system. The risk from weather perils can be reduced by limiting the exposure of homes to these risks through investment in adaptation measures such as resilience infrastructure (e.g. flood levels), making new and existing homes more resilient, and building in lower risk areas, in addition to continuing efforts to reduce greenhouse gas emissions which are the underlying cause of increasing weather perils. Reducing the risk will put downward pressure on the cost of insurance, supporting a reduction in the number of under or uninsured households and improve financial resilience.
- Insurance innovation: Alongside risk reduction, alternative approaches that lower the cost of insurance may provide a path towards improved affordability that supports the narrowing of the protection gap. These approaches may include new innovative product options from the insurance industry, alternative risk-transfer mechanisms, or public intervention where the private market is unable to support appropriate community outcomes.
- Risk management: Maintaining the financial resilience of regulated entities will be critical to ensuring that the protection gap does not translate directly into systemic risk. This is important as there is likely to be some widening of the protection gap even if effective risk reduction is achieved and affordable insurance options are made available.
Introduction
A widening insurance protection gap is a financial vulnerability that has been recognised by industry, governments and regulators in Australia and globally in recent years.11 This report investigates how the home insurance protection gap in Australia may evolve in the future, and the implications for risk in the financial system.
As the prudential supervisor for Australia’s banks, insurers, and superannuation funds, APRA is responsible for promoting the safety and stability of Australia’s financial system. To identify and mitigate risks and vulnerabilities in the financial system, APRA uses a forward-looking, risk-based, and outcomes-focused approach.
APRA has conducted the Insurance Climate Vulnerability Assessment (Insurance CVA) stress test to help identify the risks, vulnerabilities, and impact to the resilience of the financial system from falling insurance coverage. This is in line with Priority 6 of the Australian Federal Government’s Sustainable Finance Roadmap. While a number of APRA’s global peer regulators have carried out climate stress tests, the Insurance CVA is the first to focus exclusively on the insurance protection gap through an analysis of affordability.
1.1 Insurance plays an important role in the resilience of Australia’s financial system
Insurance acts as a financial shock absorber against unexpected losses and supports the resilience of Australian households and the financial system: particularly in the face of weather perils. Insurance transfers financial risk away from policyholders in exchange for receiving premiums. Insurers redistribute this risk through ‘pooling’, which spreads the cover over a larger group of policies, and the wider insurance market. Insurers also transfer part of this risk to global reinsurers, bringing international capital into the system and reducing the financial exposure of Australia’s domestic market.
Homes are important as both a place of residence and (typically) the largest asset for households, while mortgage lending is also the largest loan segment of Australian banks.12 In addition to protecting households, home insurance protects banks against losses in their mortgage portfolios from unexpected shocks like weather perils, which can contribute to mortgage defaults. Home insurance therefore plays a key role in managing the financial risk of weather perils on Australia’s financial system while protecting household wealth.
1.2 The home insurance protection gap
The home insurance protection gap refers to the extent to which losses impacting homes are not covered by insurance. For home insurance, this gap arises when properties are uninsured or underinsured, such as when coverage is below replacement cost or excludes certain risks (e.g. floods). Between 2015 and 2024, the protection gap in Australia resulted in 33% of economic losses from natural catastrophes being uninsured, compared to 57% globally.13 For the Insurance CVA, the home insurance protection gap is estimated based on the proportion of households that face unaffordable home insurance premiums.
Homeowners may choose not to purchase insurance for a range of reasons. However, unaffordable insurance premiums are recognised as a leading driver for underinsurance and non-insurance in Australia and globally. Other drivers include a lack of perceived value, and/or awareness or trust in insurers.14 The overall affordability of home insurance premiums declines when income growth does not keep pace with growth in insurance premiums. Between 2010 and 2025, Australian home insurance premiums rose by an annual average rate of 7.2%15, while wages grew annually by 3.1%.16
More frequent and severe weather events17 are driving premium increases as insurers reprice to reflect the higher risk,18 and further increases in weather risk are therefore likely to further reduce affordability: absent intervention, this could widen the insurance protection gap and erode the resilience of Australia’s financial system. In addition, premiums have also risen due to construction cost inflation and higher reinsurance costs, both of which are influenced by weather peril risk.19
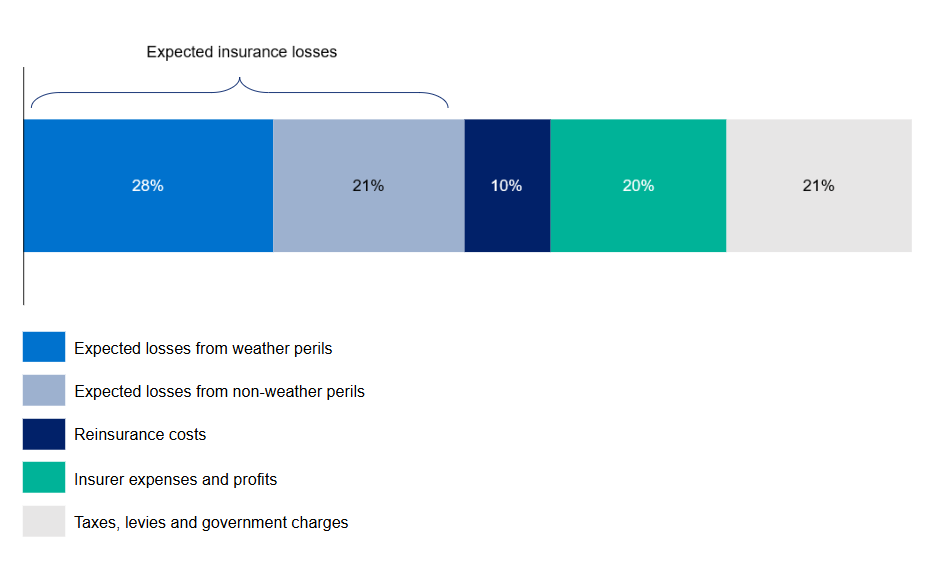
While insurer profits from home insurance can be highly variable year-to-year, including periods of negative profit, the stress test design used the simplifying assumption that insurers’ future combined expenses and profits would account for a proportion of retail premiums similar to the insurer’s longer-run historic experience.20 Finally, taxes, levies and government charges contribute around 21% on average nationally and can compound increases in underlying risk premiums (Figure 2). The relative contribution of taxes, levies and government charges varies by jurisdiction.
Figure 2: National average premium breakdown for current home insurance policies (2024)21
1.3 The impact of a widening protection gap
A widening protection gap erodes the ability of insurance to act as a shock absorber for Australia’s financial system. As the potential losses from weather perils increase, both the need for and the cost of insurance are expected to increase. A widening protection gap leaves more households (and their lenders) with greater financial exposure to potential uninsured losses, thereby impacting overall system resilience (Figure 3).
Households
Homes are a key store of wealth for many Australian households. Adequate home insurance helps households recover from weather‑peril events without needing to rely as heavily on savings or additional debt, supporting financial resilience and ongoing capacity to meet mortgage repayments. In turn, this supports banks’ mortgage portfolios and helps limit the transmission of weather shocks to household spending and credit demand, strengthening resilience across the financial system and the broader economy. In areas where the protection gap is growing, shocks are more likely to result in households experiencing financial stress and being unable to maintain their mortgage repayments leading to an elevation in credit risk for banks.
As banks typically require insurance to protect the value of housing collateral, reduced insurance coverage could inhibit lending and potentially reduce the pool of eligible buyers. A subsequent reduction in the demand for properties in areas with a high protection gap could, all else being equal, reduce market values in these locations. More broadly, because insurance pricing and risk pooling can operate across geographic areas, changes in affordability and the impact on market values can be felt beyond the directly exposed locations – which underscores the value of coordinated action to reduce underlying risk and support affordability.
Insurers
Home insurance is typically renewed annually, so insurers can manage their financial risk exposure by adjusting premiums to reflect changes in weather peril risks and other cost drivers, such as construction inflation and reinsurance costs. This ability to regularly reprice risk limits prudential risk for individual insurers. However, repricing premiums can worsen affordability and further widen the insurance protection gap.
As risks rise and coverage falls in vulnerable areas, the overall insurance industry may face greater scrutiny. To address concerns over insurance availability, and to meet the societal expectation that the insurance industry continues to provide broadly affordable home insurance, the industry can continue to work collectively and through their industry bodies to identify opportunities to support vulnerable areas.
In addition, a growing protection gap may lead to fewer insurance policies being written, slowing overall market growth for insurers. This in turn could impact the size and diversification of the overall risk pool and erode the ability of insurance to act as a shock absorber for the financial system against weather perils.
Banks
Banks could face increased credit risk in their mortgage portfolios as the home insurance protection gap widens. Mortgaged properties (both the land and the home) serve as collateral, and banks require adequate insurance to safeguard the value of this collateral against unexpected events. When uninsured homes suffer damage from weather perils, the risk associated with the loans increases. This risk was explored previously in APRA’s Banking CVA (2022) and was found to arise in two ways:
- Increasing the probability of default: Repair and recovery costs from uninsured losses strain household finances, making mortgage payments harder to sustain.
- Increasing the size of loss in the event of default: Where a borrower defaults, the value of the damaged property may no longer cover the outstanding loan amount, leading to a financial loss for the bank.
The Banking CVA highlighted the interconnected nature of climate risk across financial institutions – including the role of insurance – and the need for this to be considered in scenario analysis. The Insurance CVA builds on this earlier work by improving understanding of the potential scale and mechanisms through which climate risk may transmit through the financial system by examining how the home insurance protection gap may evolve.
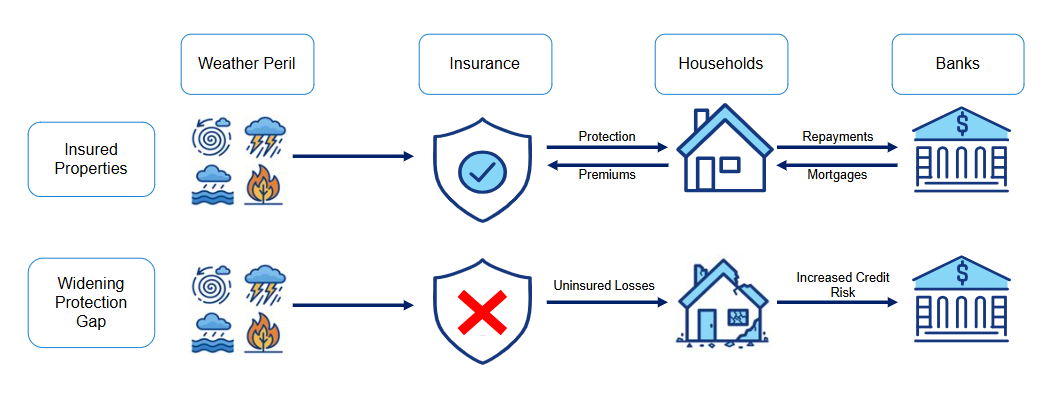
Figure 3: Transmission of weather perils to prudential risks
1.4 How APRA’s stress test explored the future of home insurance affordability
APRA conducted the Insurance CVA to better understand the risks that the home insurance protection gap may pose to the Australian financial system. This stress test involved risk and premium modelling by five of Australia’s largest general insurers – Allianz, Hollard, IAG, QBE and Suncorp – that together account for around 80% of the Australian home insurance market by gross written premium (GWP).
Stress testing is a core component of APRA’s prudential toolkit for maintaining the financial safety of institutions and the stability of the Australian financial system. APRA uses stress testing to provide a risk-based, forward-looking assessment of how severe but plausible scenarios may affect the Australian financial system. Stress testing does not provide a forecast or prediction; instead, it provides insights into the impact adverse conditions may have on entities, and of the financial stability challenges that may arise under different scenarios.
The Insurance CVA is a stress test that explores the risks and implications for home insurance affordability under two global climate scenarios that are aligned to scenarios developed by the NGFS (Table 1):
- Current Policies Scenario (CPS) – This is a higher physical risk scenario in which no additional climate policy actions are taken across the global economy, and global greenhouse gas emissions remain elevated. The weather peril modelling was based on the upper level of potential physical climate outcomes for this scenario (see Section 4.1), resulting in significantly elevated weather peril risks. These scenario settings put upwards pressure on premiums and impacting the broader economy, with economic growth slowing and income growth deteriorating consistently to 2050. At the same time, construction costs (which impact premiums via sum insured) remain elevated in line with historical trends.
- Delayed Transition Scenario (DTS) – This is a higher transition risk scenario in which no additional climate policy actions are taken across the global economy to 2030, but there is rapid global action to reduce global greenhouse gas emissions after 2030. This results in weather losses growing at a lower rate (compared to the CPS), while there is a more significant and ongoing upward pressure on construction costs (a key driver of premiums). The DTS also results in a sharper dip in income growth associated with global climate policy action in 2030, with income growth recovering in subsequent years.
The stress test adopts the simplifying assumption that no additional public policy actions or physical adaptation measures are introduced to reduce or adapt to climate risks in Australia’s housing market or broader economy. This “static policy” approach is commonly used in APRA’s stress testing, and for the Insurance CVA, it helps to isolate the key drivers of the protection gap and how these may evolve over time. See Section 4 for further detail on the modelling assumptions.
Table 1: NGFS Scenario Summary
| CPS | DTS |
|---|---|---|
2050 global average warming | +2.5⁰C | +1.8⁰C |
Pace of emissions reduction | Minor decrease from current levels by 2050 | Rapid decrease from |
Physical risk level | Higher | Medium |
Transition risk level | Lower | Higher |
Additional physical adaptation in the housing stock | None | None |
Assessing Australia’s Home Insurance Protection Gap
The Insurance CVA assessed Australia’s home insurance protection gap by estimating the number of free-standing houses that are likely to face unaffordable home insurance premiums for all insurable weather events (including flood) to 2050.
An insurance affordability metric was calculated for each in-scope property22 by dividing the modelled annual insurance premium by the estimated weekly household income for the property. Insurance was considered unaffordable for homes where the annual insurance premium equalled or exceeded four weeks of household income.23 In these cases, homes were modelled as uninsured. Underinsurance was not directly modelled in this stress test due to its complexity; however, increased affordability stress could also contribute to underinsurance.
This approach was followed for each in-scope house – around 10 million houses across Australia – between 2024 and 2050 under both climate scenarios. From this approach, APRA has inferred the size of the home insurance protection gap in Australia, and how it might change over time under the two scenarios.
2. Key findings
2.1 Under both scenarios a widening insurance protection gap leads to more uninsured losses
Today, around one in seven Australian households are estimated to be uninsured. This could increase to one in four by 2050.
Home insurance affordability is already a challenge for a significant number of Australian households. The stress test results suggest that around 15% of Australian households (or 1.4 million households) currently face high insurance affordability pressure and are therefore likely to be without insurance.24
The stress test results further suggest that there could be a sustained widening of the home insurance protection gap in Australia in the future. The results show that around 25% of Australian households may be without home insurance protection by 2050 - an additional one million households compared to today - under both scenarios (Figure 4). This is equivalent to around 40,000 additional households (on average) losing insurance protection every year for the next 25 years.
A widening protection gap would lead to greater uninsured losses for households and a likely amplification in prudential risk for financial system participants, including increased credit risk for banks, impacts on credit demand and supply, and constrained market growth for insurers.
Figure 4: Growth of the protection gap to 2050 in the CVA scenarios

2.2 The drivers of a widening insurance protection gap differ in each scenario
Increases in direct losses from weather perils, together with climate-related economic impacts, play a significant role in widening the protection gap in both scenarios
The insurance protection gap can widen either because premiums rise and/or because households’ capacity to pay falls. Climate-related risks affect both factors: increases in weather-related losses push premiums higher, while the broader economy is affected by physical and transition-related disruption which impacts incomes and construction costs.
The stress test results suggest that the overall increase in the protection gap to 2050 would be similar across both scenarios. Non-climate risk-related economic impacts drive less than 20% of the increase in the protection gap, while the remaining 80% of the increase in these scenarios is driven by climate risk-related factors (Figure 5):
- In the CPS, increased weather perils are the dominant driver of higher premium prices and a widening protection gap. Further pressure on affordability results from deteriorating income growth (due to ongoing unproductive physical damage) not keeping pace with construction costs.
- In the DTS, the economic impact of a delayed transition is the dominant driver of changes in the protection gap. Elevated construction costs drive significant increases in premiums over the longer term as loss claims for all houses become more expensive. This combines with a drop in income growth rates in 2030, with income growth recovering to 2050.
This shows that growth in the protection gap can be driven by multiple factors, including both weather risk and economic factors. Understanding the root cause of the protection gap allows stakeholders, including governments and industry, to more effectively address the associated risks.
Figure 5: Drivers of the widening protection gap to 2050, by scenario

2.2.1 The impact of more frequent and severe weather events on the insurance protection gap
Losses due to weather perils are the single largest driver of home insurance premiums today (Figure 2), highlighting the central role that weather-related risks play in protection gap dynamics. The stress test results suggest that weather peril losses are expected to rise significantly under both CVA scenarios:
- In the CPS, expected annual weather losses across all homes are projected to increase by 140%, reaching $16.3 billion by 2050.
- In the DTS, expected annual weather losses across all homes are projected to increase by 84%, reaching $12.4 billion by 2050.
The rate of change in weather peril losses differs significantly by peril and by scenario (Figure 6); however, losses from all four weather perils – storm and hail, flood, bushfire and cyclone – grow faster in the CPS scenario than in the DTS scenario. Weather-related losses therefore play a greater role in the widening of the protection gap in the CPS. Furthermore, as exposure to each peril differs by location, the protection gap will tend to grow unevenly, with some regions impacted significantly more than others.
Figure 6: Growth in expected weather loss rates for DTS and CPS between 2024 and 2050
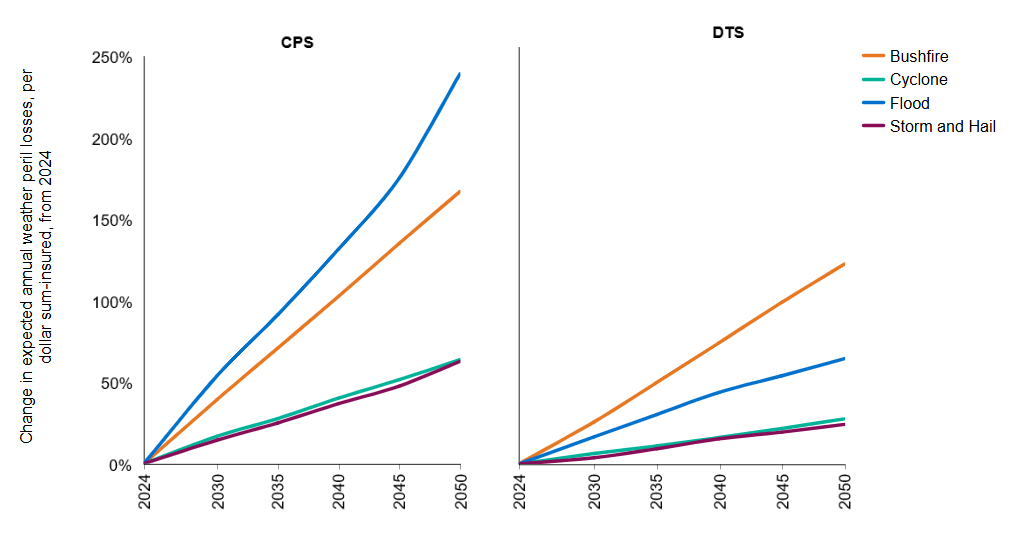
The different loss rate trajectories between the two stress test scenarios also suggest that weather losses may continue to put more pressure on insurance premiums in the CPS than in the DTS beyond 2050. For example, the modelling data suggests that the growth rate for weather losses for the CPS increases from 2045 onwards, mostly due to increasing flood losses.
The increased growth in weather losses is particularly apparent for those households facing high insurance affordability stress and most likely to be uninsured, and more severe under the CPS than the DTS. Under the stress test settings, this cohort could experience an increase in loss rates25 that would be close to five times higher in the CPS compared to the DTS.
Storm and hail events are the largest contributor to weather peril losses under both scenarios, both today and in 2050 (Figure 7). Expected losses from storm and hail events currently exceed $4 billion annually, and are modelled to rise to around $6.7 billion under the DTS and $7.8 billion under the CPS by 2050. Although storm and hail losses remain high, their growth rate is slower than other weather perils in the stress test. Exposure to storm and hail risk is widespread – almost all households face this risk both now and in 2050 – yet losses are geographically concentrated. Around half of storm and hail losses occurring in roughly a quarter of regions across Australia, driven in part by the concentration of homes rather than the level of risk.
Flood risk affects more than half of Australian homes today, and the stress test results showed flood risk to be the most climate‑sensitive of the weather perils with losses projected to increase by around 240% (CPS) by 2050. This is around four times the rate of increase seen in the lower‑emissions DTS scenario (Figure 6) and equates to an additional $1.5 billion (DTS) to $3.9 billion (CPS) in expected annual flood losses by 2050 (Figure 7).
Flood losses are projected to remain highly concentrated, with 50% of all losses projected to occur in just 10% of regions across Australia. For impacted regions there would be an increase in the risk of underinsurance if households choose to not insure against flood risk26, leading to a flood-specific insurance protection gap. This can be especially acute in flood-affected regions; the ICA estimates that 77% of homes facing severe to extreme flood risk do not have flood insurance today.
Annual losses from bushfire ($500 million) and cyclone (nearly $900 million) events are comparatively small components of overall weather peril losses today (Figure 7). However, bushfire losses are projected to grow faster than cyclone losses in both scenarios, with both perils accounting for over $1.4 billion of losses in both scenarios by 2050. These losses are highly concentrated, with 50% of all losses from both bushfire and cyclone events occurring in less than 10% of regions, both today and in the future. These perils can be a significant contributor to insurance premiums (and, in turn, the protection gap) in highly exposed regions, despite being smaller contributors to weather losses at the national level (Figure 7).
Figure 7: Change in absolute expected weather peril losses for DTS and CPS

2.2.2 The economic impacts of climate-driven risks on the insurance protection gap
Under the stress test, climate risks affected the protection gap through two pathways: higher weather‑related losses, and broader economic impacts. Where income growth fails to keep pace with construction cost inflation (a key premium input), affordability deteriorates independent of changes in hazard exposure.
In the CPS, the economic modelling shows growing losses from weather perils weighing heavily on economic activity and income growth throughout the scenario across a broad base of economic sectors. Income growth therefore does not keep pace with construction cost inflation, which leads to an increase in insurance costs and reduced affordability – even for homes not directly exposed to higher weather peril risk. This represents a secondary contribution to the widening protection gap in the CPS.
The introduction of significant policy changes from 2030 onwards in the DTS leads to a rapid reduction in greenhouse gas emissions.27 The economic modelling carried out for this stress test suggests that these policy changes drive consistently higher construction costs, in part because construction materials are emissions intensive and can be difficult or costly to substitute.
In the DTS, the consistent pressure on construction costs pushes insurance premiums higher while income growth is slowed as economic growth is impacted by more stringent policy. The slowdown in income growth is most pronounced between 2030 and 2040 putting pressure on insurance affordability. However, income growth begins to improve after 2040 as the economy adjusts following the initial rapid change in policy. Together, these economic impacts are the dominant cause of home insurance becoming less affordable in Australia, in the DTS.
2.3 The insurance protection gap is likely to remain geographically concentrated
The insurance protection gap is likely to disproportionately affect regions outside capital cities, with higher concentrations in New South Wales and Queensland
Regional and rural communities experience a wider protection gap compared to capital cities, today and (more significantly) in the future under both scenarios (Figure 8). The stress test results show almost 11% of households in capital cities are likely to be uninsured today, rising to nearly 20% in both scenarios by 2050. By comparison, regional centres and rural areas are disproportionately affected, with around 20% and 25% of households (respectively) likely to be currently uninsured. In both stress test scenarios, there is a larger increase in the protection gap in regional and rural areas: by 2050 it is estimated that over 30% of households in regional centres and over 40% in rural areas may be uninsured.
Figure 8: Change in the protection gap to 2050 in capital cities, regional centres and rural areas

The results indicate substantial geographic variation in the home insurance protection gap across Australia.28 By 2050, the protection gap is projected to widen in every region; however, regions with a larger protection gap today also tend to see the largest increases over time (Figure 9). This materially increases the number of regions experiencing a large protection gap: the share of regions where more than one‑third of households face non-insurances rises from 8% today to over 25% by 2050 under both scenarios – an eight‑fold increase. These high protection gap regions are also more likely to experience disproportionately larger increases in weather‑related losses than other parts of Australia.
The stress test results showed that there are pockets of low insurance coverage across the country today, and in the future under both scenarios (Figure 10). Households in New South Wales and Queensland account for the majority of uninsured households in Australia, with the modelling suggesting that around 60% of uninsured homes across Australia could be in those two states both today and in 2050 in each scenario. This is driven partly by Australia’s population distribution, with New South Wales and Queensland accounting for over half of the total houses. However, it is also compounded by higher rates of uninsurance compared to other states. The protection gap in both NSW and QLD rises from below 20% today (versus a 15% national average protection gap) to over 30% in both scenarios by 2050 (versus a projected 25-26% national average protection gap in 2050).
Of the 20 SA3 regions with the widest protection gaps in Australia today, 90% are in New South Wales or Queensland. The data suggests that in 2050, these states will still account for 90% of regions with the widest protection gap under the DTS, rising to 100% of high protection gap regions under the CPS. Of these 20 regions, the majority fall within regional centres, with some pockets of low insurance coverage in the capital cities. This concentration of highly affected regions is driven, in part, by regional areas within these states being significantly exposed to flood risk.
Figure 9: Protection gap by SA4 region, today and in 2050

Figure 10: East Coast of Australia - Protection gap by SA3

3. Addressing the home insurance protection gap and its related risks
The scenarios used in the Insurance CVA stress test assume no further policy intervention or physical adaptation to alleviate the potential impacts of unmanaged climate risks on the protection gap. In practice there are several levers available to reduce the risks faced by homeowners, and thereby moderate subsequent impacts to the financial system. Reducing the underlying risk from weather perils is likely to be the most effective approach to addressing the protection gap in the longer-term. Consideration should be given to near-term measures that support insurance affordability – such as enabling innovative insurance products and supporting sustainable household income growth – while ensuring that risks that transmit into the financial system are well managed.
3.1 Reducing weather peril risks
With weather peril risks typically accounting for the largest component of insurer premiums, reducing the underlying risk from weather perils can play a meaningful role in addressing the home insurance protection gap and therefore reducing the negative consequences that would otherwise be borne by households, governments and the financial system. Achieving this will require both a focus on the mitigation of greenhouse gases to reduce the underlying cause of increasing weather risk, and further efforts to adapt to these risks.
Adaptation is more effective if it both reduces the exposure of Australia’s housing stock to future weather events – such as through risk-based land-use planning – and strengthens the resilience of homes so that weather events are less costly when they occur, such as through improved building regulations, building protective infrastructure, or retrofitting existing houses. Pre-emptive physical adaptation can shield Australian communities from economic losses, support improved insurance affordability and help to narrow the protection gap.
3.1.1 Risk reduction in current housing stock
The protection gap can be alleviated by implementing resilience measures that reduce weather peril risks, via community-level and/or household-level adaptation.
Adapting to increasing weather risks may involve building or upgrading protective infrastructure that safeguards exposed communities. Examples of these interventions include flood levees, fire breaks or enhanced stormwater drainage systems.
While individual households can take steps to improve the resilience of their homes, achieving meaningful risk reduction at a community-level is likely to require coordinated investment and action across governments, communities, industry, and regulators. Where these larger-scale resilience measures translate into lower insurance premiums, affordability improves and the prevalence of underinsurance or non-insurance may be reduced.
Insurers already support adaptation efforts by sharing their expertise in weather-related hazards, and how these translate into financial losses, with government and community stakeholders. This can in turn help inform governments on how adaptation measures can be best implemented to reduce risk. This collaboration is already occurring through initiatives such as the Hazards Insurance Partnership (HIP), which builds on work underway to support investment in resilience through the Disaster Ready Fund.
Through the HIP, the Australian Government and the insurance industry have recently agreed and released a set of Guiding Principles for Resilience Investment. The Guiding Principles provide a foundation to support prioritisation of investment in community and household infrastructure, which can reduce risk and be recognised by insurers in the peril component of premiums.
While some household-level adaptation and resilience measures can be simple and low cost, others can be complex and expensive. There is an opportunity for insurers, banks, and governments to consider how they can support efforts by households to reduce their risk exposure. This can include sharing risk insights (i.e. data products), running education programs, timely warnings, or financial recognition (i.e. price adjustments).
Recognising risk‑reduction efforts in the pricing of financial products, such as insurance policies and mortgage loans, can help incentivise investment in resilience at both household and community levels. Some insurers and banks are already developing capabilities to identify, assess and verify enduring resilience measures, allowing risk‑reduction actions to be reflected in lower insurance premiums or discounted mortgage rates.
Initiatives such as the Bushfire Resilience Rating Home Self-Assessment App demonstrate how shared risk insights can translate resilience improvements into downward pressure on insurance premiums and mortgage rates, thereby encouraging risk‑reduction efforts and contributing to a narrowing of the home insurance protection gap. There is an opportunity to broaden the approach to different weather risks and increasing the prevalence of such initiatives across the market.
APRA will support ongoing efforts to reduce weather peril risk to Australia’s housing stock by providing additional insights from the Insurance CVA to the Federal Government and key agencies such as the National Emergency Management Authority (NEMA, which leads the HIP) and the Department of Climate Change, Energy, Environment and Water (DCCEEW), and peer regulators.
3.1.2 Risk reduction in future housing stock
While this stress test focused on the current stock of freestanding homes, the insurability of new homes built in the future will also influence how the protection gap changes over time. If more resilient homes are built in lower‑risk areas, this would put downward pressure on Australia’s future protection gap. As Australia’s housing stock expands, governments and industry have the opportunity to leverage planning and regulatory tools to incentivise building homes in lower‑risk locations, thereby supporting long‑term insurability. Where future homes are being considered in areas where there is a material weather risk, governments should consider whether stronger building regulations, additional protective infrastructure or a combination of the two would be an appropriate strategy to manage the risk.
These decisions may also be informed by insights from the insurance industry on the risk profile of different areas, and the effectiveness of different resilience measures. For example, using land planning to limit new building may be most effective when deployed in areas of concentrated risk, such as in low-lying areas where flood risk is elevated. Building regulations, on the other hand, may be more efficient when used to reduce exposure to widespread weather perils such as storm and hail, or when protective infrastructure is unavailable or becomes unreliable. This could include measures such as those included in NEMA’s guide for building a storm and cyclone resilient home.
3.1.3 Emissions mitigation
There is broad scientific consensus that reducing greenhouse gas emissions addresses the key driver of increasing systemic weather peril risk over the longer-term.29 The effect of falling annual GHG emissions is reflected in the results from the DTS, where projected annual weather peril losses30 are around 32% below that shown in the higher emissions CPS in 2050.
Financial entities could consider how they can work together with their customers to best support the national emissions targets (both in the shorter and longer term) set out by Australia’s Nationally Determined Contributions under the Paris Agreement.
Entities seeking to reduce greenhouse gas emissions could also consider the economic impacts on communities, as these actions can affect insurance affordability stress. The role of climate-driven transition risks is more apparent in the DTS which follows a disorderly path to lower emissions from 2030 onwards. In comparison, a more orderly transition to a lower emissions economy, for example where sustainable economic growth is supported, particularly in low-emissions industries, and those employed in high-emitting industries are supported into new jobs, is likely to lead to better economic outcomes and, in turn, a narrower protection gap.31
3.2 Improving insurance affordability
Alongside risk reduction, there are a range of actions that may support the affordability of home insurance and narrow the protection gap. This includes innovation in insurance products, and where necessary, public policy interventions, which can help reduce the price of insurance.
3.2.1 Innovation in insurance products
Innovation in insurance products and operations can, when accompanied by risk reduction, help lower costs and improve the affordability of insurance. Insurers could explore opportunities for innovation that reduce costs for their customers, as well as for their own operations. Governments and regulators could consider if their respective policy settings create an environment that facilitates and encourages safe and effective innovation.
New, innovative insurance products – including those offering more targeted coverage rather than comprehensive coverage – may provide low‑cost substitutes for traditional home insurance. Insurers might also seek alternative risk transfer mechanisms which may help lower the cost of capital for insurers, while technology-enabled efficiencies could help reduce operational costs. Where cost savings are realised and passed through to customers, these efforts may to some extent improve affordability in the shorter-term, while longer-term efforts to reduce underlying risks are pursued.
Alongside these industry opportunities, APRA is focused on ensuring that its regulatory approach remains supportive of safe, effective innovation in insurance. This includes regular consideration of whether capital and other prudential settings are maintaining the financial resilience of regulated entities without unduly inhibiting product innovation.
3.2.2 Public policy intervention
When the private insurance market on its own is unable to ensure adequate risk pooling or equitable outcomes for vulnerable customers, public policy intervention may be required. An example of this is the cyclone reinsurance pool established by the government in 2022 and administered by the Australian Reinsurance Pool Corporation, to lower the cost of reinsurance (and therefore insurance) for policies with medium-to-high exposure to cyclone risk while offering discounts for properties that undertake risk reduction and resilience activities.
While such policies can provide targeted support for high-risk communities, the impact is limited as components such as reinsurance, make up a smaller part of overall insurance costs compared to overall weather risks (Figure 2). Risk reduction efforts therefore still play a larger role in achieving longer-term and widespread improvements in insurance affordability.32
Governments could consider whether additional policy options are available to help narrow the home insurance protection gap for both existing housing stock in vulnerable areas, and for new and planned homes. However, any interventions would need to balance making a meaningful impact on improving insurance affordability, retaining the risk price signal provided by market-based insurance premiums (which can ultimately incentivise the building of more resilient homes in safer locations), and managing governments’ fiscal exposure. In the short term these interventions can be effective at supporting more affordable insurance; however, if the underlying risk is not addressed then insurance premiums would continue to rise to unaffordable levels in the longer term.
3.3 Managing risks to the financial system
A growing protection gap can amplify risks for the financial system, such as credit risk in banking mortgage portfolios and for insurers the risks that may follow from failing to meet societal expectations (Section 1.3). The following approaches should be considered in understanding and responding to these risks.
3.3.1 Managing mortgage credit risk
Banks are responsible for managing credit risk in their mortgage portfolios. A growing protection gap may increase this risk by eroding the financial resilience of mortgage holders – which increases the likelihood of default – while heightened exposure to weather risks may impact collateral values. Some banks have taken steps to better understand the scale of this risk and therefore improve their ability to assess the proportion of their mortgage exposures that are uninsured, particularly in high-risk areas.
While it is common practice for banks to confirm insurance coverage during the loan application process, it can be challenging for banks to monitor whether borrowers maintain adequate ongoing insurance coverage. The development of a centralised insurance register that identifies the insurance status of properties could provide greater visibility of the potential credit risk from uninsured mortgages throughout the life of a loan. Developing such a register would likely require collaboration between the insurance and banking industries, and government.
Some banks have considered the implications of non-insurance on credit risk in their mortgage portfolios. For example, the banks that participated in APRA’s Banking CVA were asked to make a forward-looking assessment of the potential for credit losses arising from defaults under different climate scenarios, including impacts from uninsured or underinsured mortgages. They may also have considered other factors that could protect their balance sheets from financial loss, such as land value, loan leverage and household wealth.
APRA will continue to supervise insurers and banks to ensure that prudential risks are well-managed. This includes ensuring banks have adequate capital to absorb losses, sufficient liquidity to meet their financial obligations, appropriate risk management and governance, and adequate operational resilience and recovery planning.
3.3.2 Meeting societal expectations
A growing protection gap may increase scrutiny on insurers as communities increasingly lose access to financial services such as insurance products and mortgage loans. Insurers operate for a commercial purpose and need to return a profit to remain in business: however, they also serve a fundamental societal purpose of transferring risk, thereby facilitating households to own property and engage in activities that would otherwise be prohibitively risky.
Decreasing insurance affordability contributes to a widening of the home insurance protection gap and detracts from the industry’s ability to broadly perform its societal purpose. As households incur higher uninsured losses, community scrutiny of insurers may intensify. Prolonged pressure of this kind could translate into calls for reform of the private insurance market as seen internationally33, with the risk of introducing distortions to market forces.
To alleviate these risks and maintain their ability to meet societal expectations, insurers should continue to proactively contribute to the whole-of-system efforts in risk reduction discussed above. This can include supporting customer outcomes by transparently communicating the drivers of increasing premiums and increasing customer awareness of the options available to help reduce the premium increases. Insurers can also engage with their customers to improve their understanding of the important role insurance plays in protecting household’s financial resilience during loss events, which may help improve the uptake of insurance.
4. Frequently Asked Questions
APRA published an Information Paper in December 2024 detailing the design of the Insurance CVA. These Frequently Asked Questions (FAQs) build on the Information Paper to provide additional insight into the design and approach taken to the Insurance CVA.
4.1 How were the Insurance CVA scenarios designed?
The Insurance CVA stress test uses global climate scenarios designed by the Network for Greening the Financial System (NGFS). APRA has relied on two long-term scenarios from the “Phase IV” vintage that result in different climate-driven risks to the financial system:
- The Current Policies Scenario (CPS) is a higher emissions scenario that leads to greater weather perils. In the CPS, current climate policies are followed through to 2050, and atmospheric greenhouse gas concentrations remain elevated. APRA used the NGFS 95th percentile temperature outcome associated with this scenario, where global average temperatures increase +2.5oC above pre-industrial levels by 2050.34
- The Delayed Transition Scenario (DTS) is a lower emissions pathway where a delayed transition to a lower emissions economy results in rapid policy and technology change. In the DTS, these policy changes are implemented from 2030 onwards, resulting in an initial economic slowdown with the economy recovering over future years. APRA used the NGFS 50th percentile temperature outcome for this scenario, where global average temperatures reach +1.8oC above pre-industrial levels by 2050.
The physical and economic impacts of each global scenario were adapted for the Australian context, in consultation with external organisations.
- Physical impacts: APRA relied on expert guidance from the Australian Climate Service on how the behaviour of weather perils around Australia (such as cyclones, bushfire, storms, extreme rain and flooding) may change under each scenario.
- Economic impacts: APRA engaged Oxford Economics Australia to model the macroeconomic outcomes of these scenarios and downscale the results to a sub-national level. Oxford Economics’ macroeconomic projections included GDP, interest rates, inflation and regional incomes.35
4.2 How were the insurance premiums modelled?
The Participating Insurers were asked to model future weather peril losses and insurance premiums using their existing pricing practices and following the scenario design instructions provided by APRA. In this way, the Insurance CVA drew upon the knowledge, skills and experience of the insurers, to determine the hazard levels and premium prices in the climate scenarios.
To estimate the overall premium, the insurers provided estimates for each of the following components:
- Average Annual Losses (AAL) from insurable perils including weather perils (storm and hail, bushfire, cyclone, flood) and other perils (such as earthquakes, theft and house fires). Insurers estimated the average annual loss from each peril for each household under each scenario using the temperature and physical guidance provided by the ACS, and typically used an interpolation approach to apply their estimations across the time horizon of the scenarios. Insurers typically sought external support from catastrophe modelers to simulate future weather losses.
- Reinsurance and other costs (such as expenses, profits) were determined by each insurer based on their historical experience. Insurer profits from home insurance can be highly variable year-to-year, including periods of negative profit: to simplify this aspect of the modelling, the stress test design used the simplifying assumption that insurers’ future combined expenses and profits would account for a proportion of retail premiums similar to the insurer’s longer-run historic experience. For Cyclone-related AALs, the Australian Reinsurance Pool Corporation (ARPC) provided a view of future cyclone reinsurance premiums under each scenario.
- Government, taxes and charges were consistent with current rates and held constant into the future.
For simplicity, the insurers were advised to maintain certain modelling parameters constant into the future. This included assuming no changes in the insurer’s product mix, pricing strategy and reinsurance arrangements and no changes in levels of market share or policy environments, including no further physical adaptation to weather risks in the housing stock.
4.3 Which houses were in scope of the analysis?
The participating insurers modelled the insurance premium for nearly 10 million freestanding Australian houses, irrespective of whether the insurer has underwritten the house or not, providing APRA with a “whole of estate” view of the current freestanding home insurance market (including homes which currently do no hold insurance). The scope excluded strata properties36 and temporary dwellings (e.g. caravans, tents) due to the complexities in modelling their premiums. Risk, premium and income modelling was carried out following the same method for both owner-occupied and rental homes.37
APRA engaged Geoscape Australia to provide a common address file for all in-scope Australian properties, which is freely available (for non-commercial use only). To protect both the privacy of individual households and commercial confidentiality, individual properties were de-identified prior to the insurers providing the associated risk and premium data to APRA.
4.3.1 Treatment of future housing stock
The CVA modelling excluded future housing stock. This approach was taken due to the uncertainty over future housing development including their location, characteristics and associated rebuild costs. However, with the national housing stock expected to increase by 35% between 2024 and 2050 (Oxford Economics), choices regarding where those houses are built may materially impact the risk and associated premium levels.
Based on preliminary sensitivity analysis, choices regarding the future housing stock could have a material impact on the protection gap by 2050. Under the two climate scenarios, the national protection gap could increase to affect 25-26% of existing houses: including new house stock could see the future protection gap fall to 23-24% (if all new houses are situated in low weather risk areas) or rise to 28-29% (if all new houses are situated in high weather risk areas). In both cases, the overall number of uninsured houses is likely to increase.
4.4 How was the protection gap estimated?
APRA analysed how the insurance protection gap may evolve under both scenarios by estimating levels of insurance affordability stress today and into the future. The protection gap reflects the number of properties projected to face unaffordable premiums, and therefore likely to become uninsured. Affordability was measured by estimating the cost (the premium) of insurance relative to a household’s ability to pay.
APRA obtained the key inputs for estimating the insurance protection gap by undertaking the following steps:
- Estimating the insurance premium for each household: APRA received an insurance premium estimate for each freestanding house across Australia, from each of the five participating insurers, based on the Geoscape dataset. For each house, APRA then selected a single premium (and its associated risk data) from the five premium estimates. This approach resulted in a premium estimate for each house in national housing inventory.38 This includes properties that are either had insurance cover with a participating insurer, did not have insurance cover with a participating insurer, or was uninsured in 2024. The method for selecting a premium estimate for each property differed depending on whether it was underwritten by a participating insurer or not:
- Where a property had an insurance policy underwritten by any of the participating insurers, then that insurer’s estimate was used for the property. (This cohort represents approximately 80% of the private home insurance market by gross written premium).
- Where a property did not have an insurance policy underwritten by any of the participating insurers, then an estimate from one of the participating insurers was selected using a randomised selection process that was weighted based on insurer market share in the region. (This cohort represents approximately 20% of the private home insurance market by gross written premium).
- Estimating household income: Household annual income was estimated out to 2050 based on the regional average household income levels modelled by Oxford Economics, which were then downscaled to the individual property level using regional household income distributions and correlation factors.39
- Calculating the affordability metric: For each property, the home insurance premium was divided by the modelled weekly household income to determine a household affordability metric, i.e. an estimate of the number of weeks of household income required to meet the premium.
- Quantifying affordability stress: households were considered to have affordability stress if the affordability metric was equal to or greater than four weeks of household income.
4.4.2 Variation within insurer views of premiums
Based on the combined singular industry view of premiums, the home insurance protection gap may rise from 15% today to around 25% (CPS) or 26% (DTS) by 2050 under each scenario. However, there were material variations between the home insurance premium estimates provided by each insurer. For example, one insurer’s premiums implied that the protection gap would rise from 12% today to 15% in 2050, while another found the gap widened from 17% today to 40% in 2050. This reflects the uncertainty in weather peril risk and economic factors that drive changes in premiums and the protection gap, as well as underlying differences that influence insurers premiums at the starting point (such as reinsurance arrangements and expenses).
While insurers provided differing views of absolute risk levels and growth, there was greater consistency within insurer results over which regions were at higher or lower weather peril risk. There was greater variation between insurer estimates for flood and bushfire losses than for cyclone and storm, although this may have been influenced by the scenario design and parameters provided (e.g., all insurers were provided the same reinsurance pricing data for cyclone risk).
4.4.3 Sensitivity of the protection gap to the affordability metric threshold
A household was assumed to experience insurance affordability stress where the affordability metric for the household exceeded four weeks of household income. This affordability metric threshold aligns with prior work published by the Actuaries Institute. However, the results of the Insurance CVA are sensitive to the affordability metric threshold: for example, a threshold of three weeks would imply that affordability stress is at 21% today and may rise to 33% by 2050 (CPS), while a threshold of five weeks would imply that affordability stress is at 11% today and may rise to 20% by 2050 (CPS). Nonetheless, the analysis suggests that the relative increase in affordability stress - and the associated home insurance protection gap - from 2024 to 2050 remains broadly consistent when using different affordability metric thresholds.
4.5 Acknowledgements
APRA acknowledges the various data providers, reviewers and consultants that contributed to the Climate Vulnerability Assessment. This includes:
- The participating insurers - IAG, Suncorp, Allianz, QBE and Hollard
- Insurance Council of Australia (ICA)
- Australian Climate Service (ACS)
- Australian Bureau of Statistics (ABS)
- Australian Reinsurance Pool Corporation (ARPC)
- Geoscape
- Oxford Economics
- UNSW School of Risk and Actuarial Studies
- Institute of Actuaries of Australia
- Finity Consulting Pty Ltd
We acknowledge additional contributors to the design of this stress test.
All conclusions in the publication are those of APRA and the contributors do not bear any liability or responsibility for any view expressed in this publication.