Key statistics
| - | December 2024 | December 2025 | Year-on-year change |
|---|---|---|---|
| Total superannuation assets ($bn) | 4,150.8 | 4,485.5 | +8.1% |
| Total APRA-regulated assets ($bn) | 2,916.6 | 3,181.4 | +9.1% |
| Total self-managed super fund assets ($bn) | 1,001.7 | 1,061.4 | +6.0% |
| Exempt public sector superannuation schemes assets ($bn) | 175.2 | 182.1 | +3.9% |
| Balance of life office statutory fund assets ($bn) | 57.3 | 60.6 | +5.8% |
Entities with more than six members
| - | December 2024 | December 2025 | Year-on-year change |
|---|---|---|---|
| Total contributions ($bn) | 198.1 | 220.8 | +11.5% |
| Total benefit payments ($bn) of which: | 124.4 | 139.9 | +12.5% |
Lump sum benefit payments ($bn) | 68.2 | 77.6 | +13.8% |
Pension payments ($bn) | 56.2 | 62.3 | +10.8% |
| Net contribution flows* ($bn) | 68.1 | 72.2 | +6.1% |
| Annual Rate of Return (%) | 11.1 | 8.7 | -2.4% |
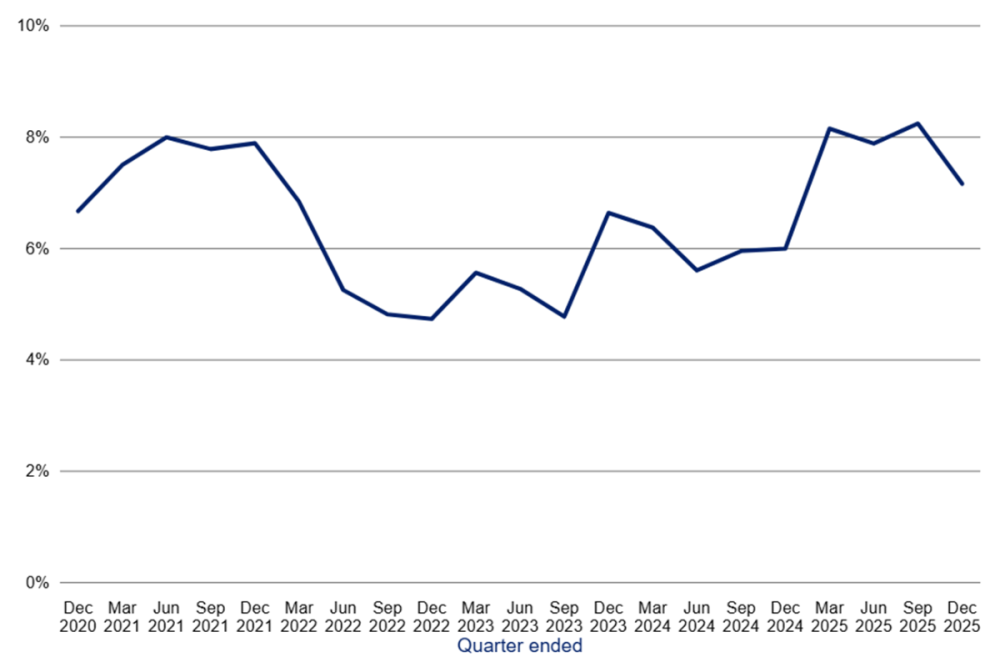
| Five-year annualised Rate of Return (%) | 6.0 | 7.2 | +1.2% |
*Net contribution flows comprise of contributions plus net benefit transfers, less benefit payments
Chart 1: Assets of superannuation entities
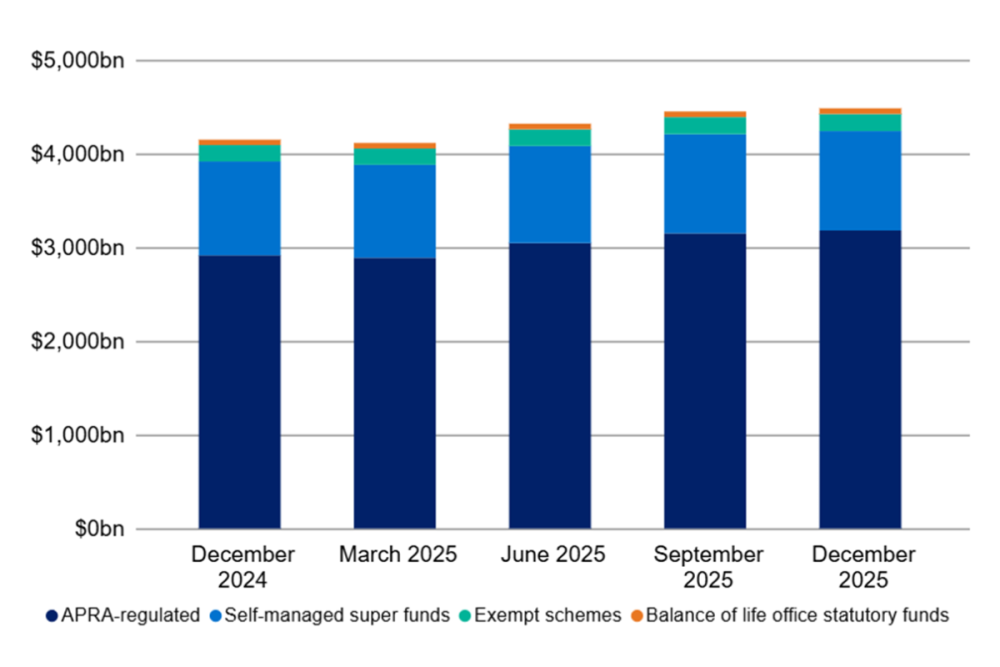
Chart 2: Benefit Payments
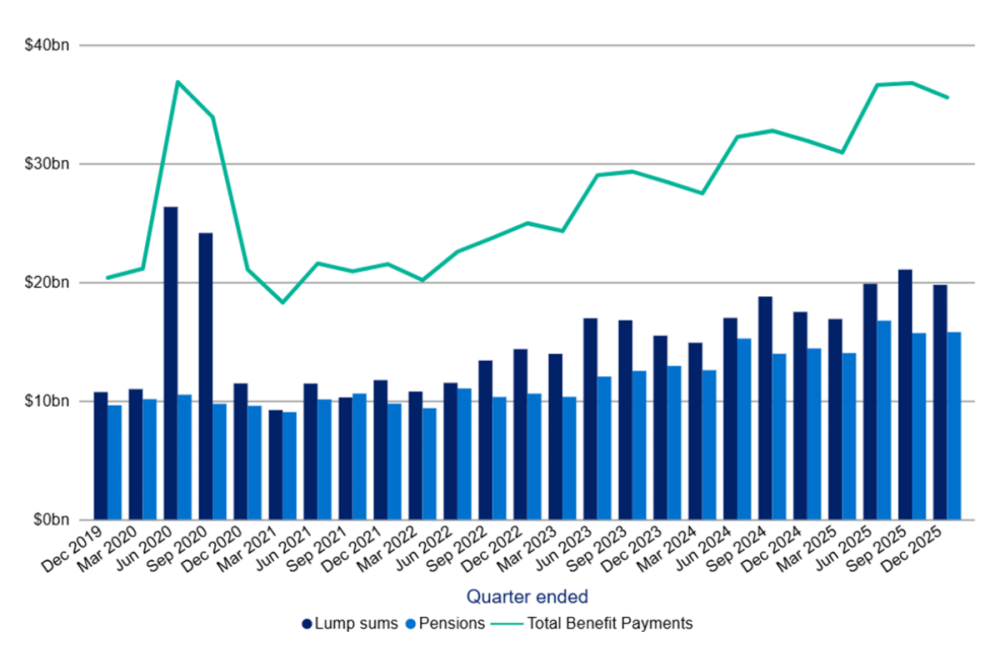
Chart 3: Net contribution flows
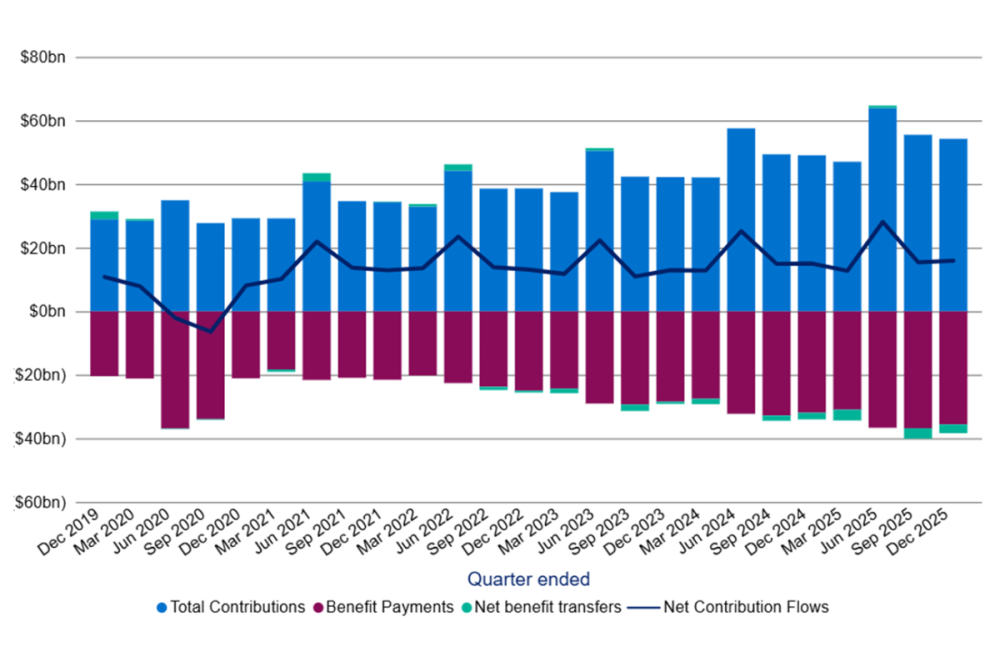
Chart 4: Five-year annualised rate of return