Information paper

System Risk Stress Test

Final report on findings from the inaugural exercise.
All industries
Published
30 June 2026

Executive Summary

APRA’s mandate is to provide Australians with a safe and stable financial system. This objective is critical to the Australian community’s financial wellbeing and the growth of the Australian economy. A resilient financial system supports economic activity by providing credit, payment, investment and risk-transfer services to households and businesses, even if economic and financial conditions deteriorate.

Stress testing helps assess how shocks can spread, and the effects of both the shocks and entities’ responses. System-wide stress testing can reveal vulnerabilities and amplification mechanisms, including how shocks can transmit across industries, and can deepen understanding of financial system resilience.

System risks and interconnectedness

The Australian financial system has become more interconnected. Banks, superannuation funds, insurers, and financial markets are linked through funding relationships, asset holdings, market participation and shared service providers. These connections underpin efficiency and help build resilience in normal times, but they can also enable stress to transmit across institutions, sectors and markets when conditions deteriorate. In a more connected financial system, the behaviours of financial institutions are an important determinant of how shocks transmit, and can act to either amplify or absorb the initial shock. Decisions are often made with incomplete information, under rapidly changing conditions, and with limited visibility of how other entities and markets will respond.

The external environment has also become increasingly uncertain and globally interconnected, with shocks arising from geopolitical developments, cyber threats, demographic trends and threats to public health. These shocks can have negative impacts on the Australian economy and financial system, including reduced economic activity, financial market dislocation and operational disruptions, and can involve multiple sources of stress occurring simultaneously.

Growing role of superannuation in the Australian financial system

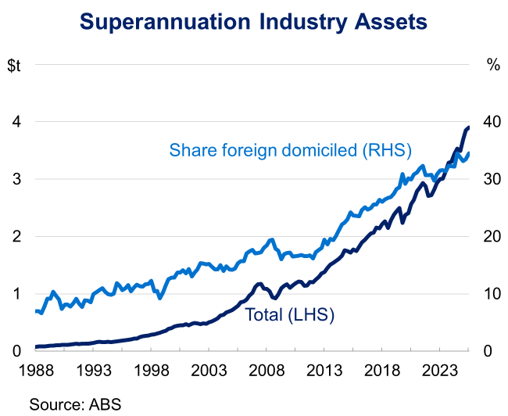
The superannuation industry is increasing in systemic importance due to its growing scale, interconnection, and influence on household wealth and real‑economy outcomes. Assets in APRA-regulated superannuation funds grew from $1.3 trillion in 2015 to $3.2 trillion by the end of 2025. Superannuation now accounts for almost half of the financial assets of households in Australia. By 2060, some forecasts suggest assets managed in the superannuation system could reach almost 250 per cent of GDP. 1The superannuation system is also in the process of changing from one dominated by accumulation accounts, in which members cannot usually access their money, to one with a higher share in the retirement phase, in which superannuation has a heightened influence on household expenditure and financial decisions.

As it has grown, the superannuation sector’s importance to the rest of the financial system, particularly banks, has also grown. Superannuation funds hold around 40 per cent of banks’ domestic short-term debt, and a similar share of their equity.2 There are also very important operational linkages, with superannuation funds relying on banks for payments, foreign exchange, and custodial services. Superannuation also has deep connections with insurers through the insurance benefits provided to members.

The System Risk Stress Test

The System Risk Stress Test (SRST) was the first stress test undertaken by APRA that involved multiple regulated industries, with participation from the four major banks and six large superannuation funds. It explored how a shock could affect the Australian financial system, with a specific focus on linkages between superannuation funds and banks, and on how the growing superannuation industry could amplify or dampen system risk.

The SRST instructed participants to model a severe stress scenario. For banks, this included liquidity pressures exceeding any experienced by large Australian banks over the past 50 years. The stress applied to superannuation funds was similarly severe, with member withdrawals and switching significantly surpassing levels observed during COVID‑19 or other previous periods of financial market stress. Further, the scenario incorporated an additional disruption at a material service provider, consistent with a more complex external environment.

As with other APRA stress tests, the SRST scenarios are not forecasts or predictions. They are severe but plausible hypothetical scenarios used to test financial system resilience.

The insights from the SRST can inform APRA’s supervision and policy priorities. They also help APRA and the broader Council of Financial Regulators to continue to build resilience in the financial system and respond to negative shocks more effectively. APRA’s stress tests are also aimed at encouraging entities to uplift their own capabilities and broaden the range of risks they are prepared for.

This Information Paper sets out the key conclusions and findings from the exercise undertaken in 2025 and early 2026.

Key Findings

Finding 1

The SRST showed the resilience of the Australian financial system to market and liquidity shocks, and the features which underpin it.

All participating banks and superannuation funds were able to withstand the shock resulting from the severe SRST scenario.

This resilience was underpinned by strong and usable bank liquidity buffers, banks' access to central bank facilities, and superannuation funds’ ability to access liquidity in deep international markets.

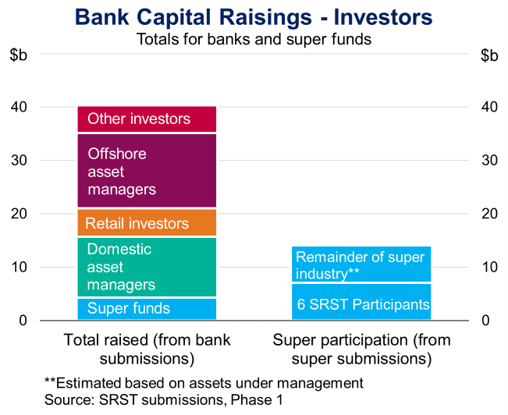
The SRST also reinforced the central role that the superannuation sector can play as a stabilising feature of the Australian financial system. Super funds were able, and willing, to provide new equity capital for the banking system, during a severe economic and financial downturn, despite being under significant stress themselves.

Response

The findings reinforce the value of strong capital, liquidity and prudential safeguards in helping the financial system absorb shocks and continue to provide critical services to households and businesses in stress. APRA will continue to apply a system-wide lens to assessing financial stability, including when setting prudential requirements.

Finding 2

The SRST highlighted system vulnerabilities, such as those related to concentration, mismatched assumptions and common dependencies, that could amplify stress events.

The interconnected nature of the Australian financial system can be a stabilising force, but in periods of severe stress these linkages can also create vulnerabilities.

Banks rely on funding from superannuation funds, and some large banks source more of their funding from this sector than others. This creates funding concentration risk for banks, and the potential for stress events to be more severe for some entities.

In addition to this concentration, participants in the SRST had different views on the likely stability, in a crisis situation, of the funding that superannuation funds provide to banks. This is the case for both short-term wholesale funding and deposits. Different expectations about how funding would hold up in a crisis could make stress harder to manage.

The exercise also highlighted risks inherent in shared material service providers. If a material service provider is disrupted, it could limit how quickly entities can undertake liquidity and risk‑management actions and therefore amplify stress. For superannuation funds, reliance on external managers may limit visibility of underlying positions.

These vulnerabilities increase the potential for shocks like those examined in the SRST to have market and economy‑wide effects. Bank responses to the SRST shocks included reducing credit availability in some segments, alongside a contraction in market lending activity that would transmit stress to other market participants.

Response

This exercise underlines how APRA’s prudential frameworks for liquidity risk management and operational risk management lay the foundation for a stable financial system. Findings from the SRST will inform proposed amendments to bank liquidity rules that will be released for consultation during 2026, and APRA’s core supervisory activities for banks and superannuation funds. The SRST findings also reinforce APRA’s continued focus on the importance of entities managing material service provider arrangements through enterprise operational risk management.

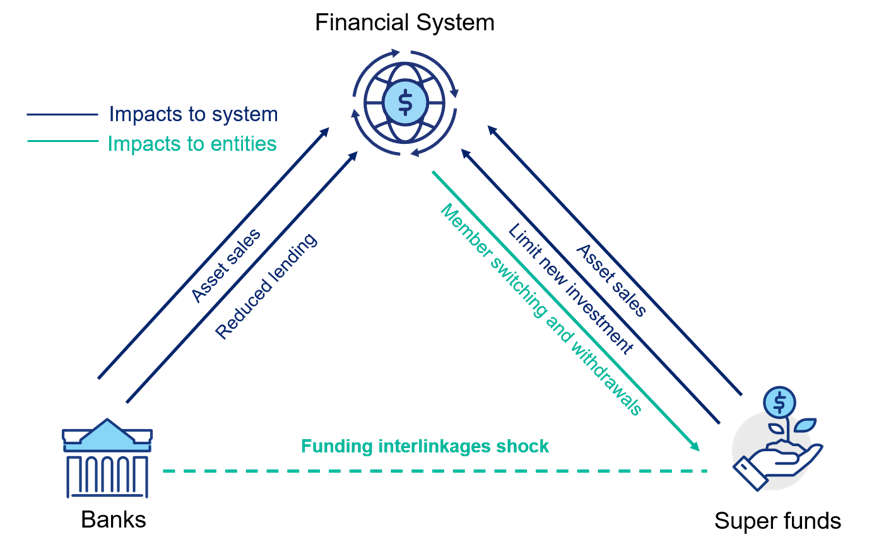
Figure 1 – Financial system risk transmissions in stress

This infographic sets out linkages between Banks, Super Funds and the financial System. These include Asset sales and Reduced lending from banks to the financial system, asset sales, limiting new investment, and member switching and withdrawals from super funds to the financial system, and funding linkages between banks and super funds.

Finding 3

Superannuation funds can play a systemic role in the stability of the Australian financial system. How they respond in a stress event can materially affect banks, financial markets and superannuation fund members.

In the SRST scenario, superannuation funds’ withdrawal of funding was a contributor to the idiosyncratic liquidity stress that each participating bank modelled. However, in the subsequent broader downturn and solvency stress, superannuation funds’ willingness to provide equity capital to banks illustrated their ability to dampen risk.

Superannuation funds also provide significant funding across the wider financial system, including to private markets. Some superannuation funds indicated that they may scale back capital injections into existing investments or limit new commitments in some unlisted markets in response to the SRST shock, which could put pressure on those markets.

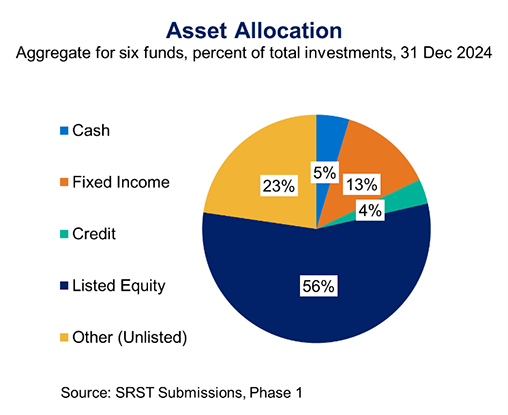
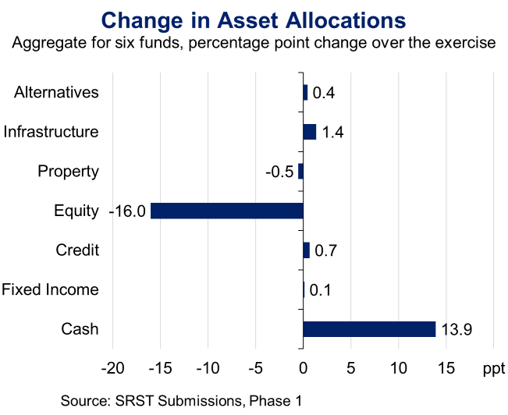
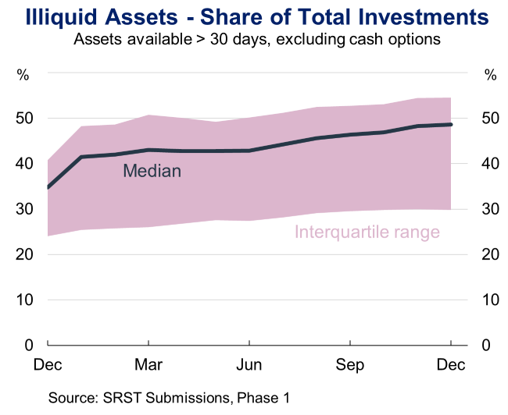
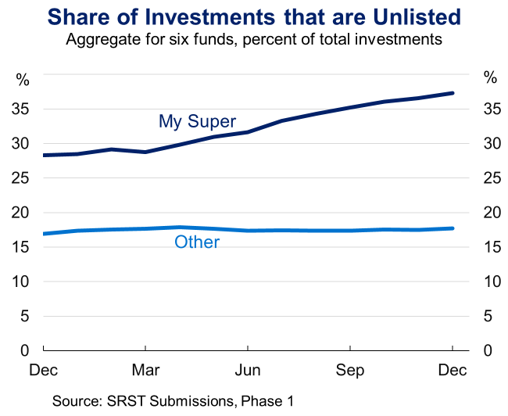
To respond to liquidity stress and raise cash in the exercise, superannuation funds primarily sold listed equities and avoided selling unlisted assets. This response helped them meet short-term needs, but it also left some members – especially members in MySuper options – more exposed to risks tied to unlisted assets, such as liquidity, valuation and sequencing risks.

Response

These findings highlight the importance of strong investment governance, sound liquidity risk management and robust valuation practices by superannuation funds, as publicly communicated by APRA. They also reinforce the need for a continued uplift of practices across the industry, including considering how their actions in stress affect both the financial system and member outcomes.

Finding 4

Some vulnerabilities in the system are likely to increase as the superannuation sector continues to grow and mature.

Superannuation is a large and growing component of the Australian financial system. Decisions by a small number of large funds could have very consequential effects across the system. As more members move into retirement, meeting pension payments and possible member withdrawals from the superannuation system will increase demands on funds’ liquidity and response capabilities.

Line graph showing superannuation industry assets from 1988 to 2024. Total assets steadily rise from near zero to about 4 trillion, while foreign domiciled share increases from around 5% to nearly 40%, with both lines showing notable growth after 2010.

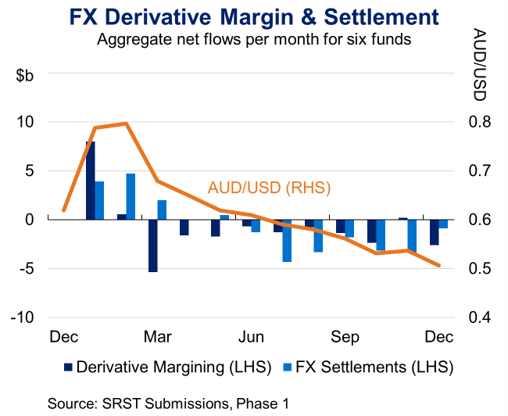
Moving forward, superannuation funds may need to invest more overseas due to size limitations in domestic markets. Over time, this will increase exposure to currency risk. Managing that risk may become more challenging if existing hedging providers, such as domestic banks, are unable to offset these exposures, leading to greater use of margining to manage these risks.

Response

APRA will continue to focus on how these risks are changing as the superannuation system matures. This includes the risk implications as more members move into the retirement phase, and the evolution of foreign exchange risks with growing overseas investments.

Finding 5

Better entity preparedness for stress events will make the financial system stronger.

The SRST highlighted that stress testing capabilities of superannuation funds need to develop to be commensurate with the sector’s systemic footprint. The growing importance of the superannuation system to the rest of the financial system, and to the wealth of Australians, highlight the importance of these capabilities. The exercise also highlighted areas where banks – who have more experience with stress testing – can further uplift their capabilities.

The SRST also showed a range of expectations across banks and superannuation funds regarding the role of public sector response in severe stress. Public action can help stabilise the system in a crisis, but entities need to be ready to respond on their own rather than overly relying on government intervention.

The exercise illustrated the importance of testing a wider range of shocks, including entity-specific events, and situations that fall outside a standard economic downturn. It also reinforced the need for stress testing that incorporates uncertainty around the behaviour of other market participants and the feasibility of management actions during periods of market disruption. Finally, it showed the benefit of looking at how banks and superannuation funds interact and focusing on impacts to the financial system, rather than assessing entities in isolation.

Response

APRA will continue to undertake exploratory and system stress tests across banks, superannuation funds, and other regulated entities. It expects regulated entities – particularly superannuation funds – to continue to develop their stress testing capabilities and crisis preparedness.

Scenario Design

The Scenario

The SRST applied a common scenario to both banks and superannuation funds. The scenario was intentionally designed to separate the timing of liquidity stress for the two industries, allowing APRA to observe how stresses might transmit between sectors. The exercise applied APRA‑specified scenario shocks and examined participants’ behavioural responses and financial outcomes. The shocks and responses are displayed in Figure 1 below, across both banking and superannuation industries. 

Figure 2 – Design of the System Risk Stress Test 

Flowchart illustrating system risk channels and entity actions during the SRST. Key elements include scenario shocks like AUD appreciation and withdrawal of funding, economic downturn effects such as AUD depreciation and market declines, and entity actions like limiting outflows, monetizing HQLA, capital raising, and investment decisions, with color-coded boxes and arrows indicating relationships and pressures.

Participating entities made two sets of submissions. The first phase explored entities’ assumptions and responses to the scenario, while the second phase tested the robustness of those findings through greater standardisation and additional analysis.

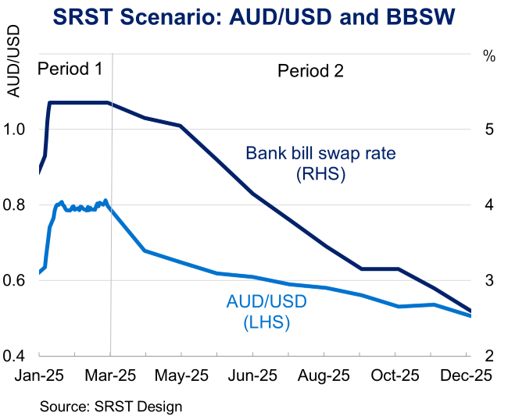
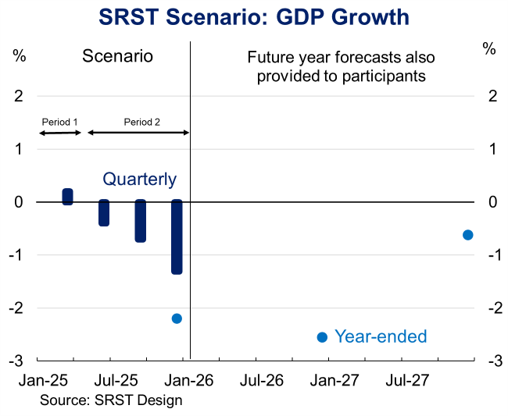
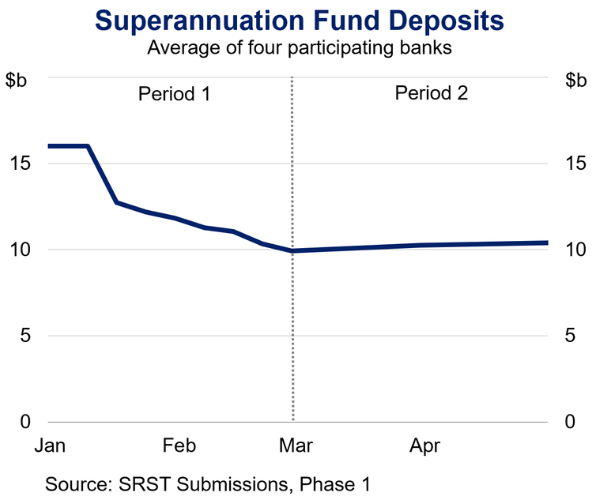
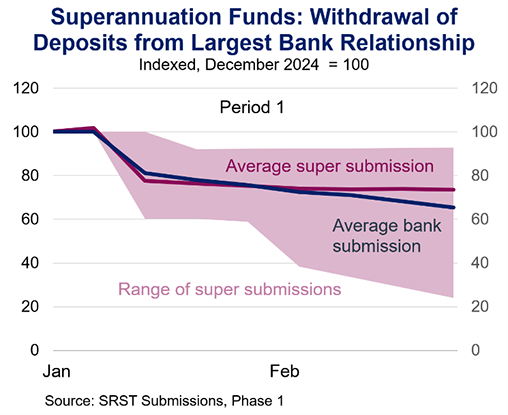
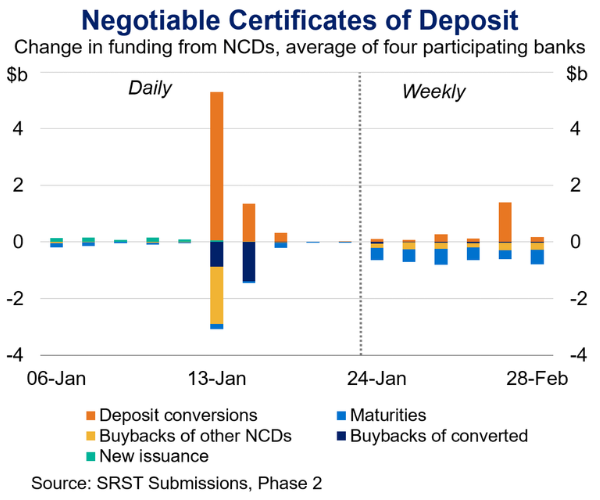
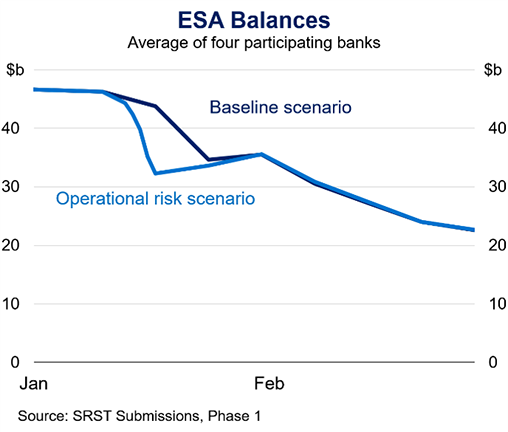
In Period 1 of the exercise, the primary focus was on the liquidity of banks. The Australian economy was assumed to be relatively strong, supported by an improvement in the outlook for a major trading partner. This was accompanied by a sharp appreciation of the Australian dollar. As banks provide foreign‑exchange hedging to other counterparties, the appreciation generated collateral flows from banks to their counterparties, reducing bank liquidity. Early in this period, each participating bank was instructed to assume they alone were each subject to an idiosyncratic funding run, affecting both wholesale and deposit funding from institutional and corporate clients, including superannuation funds. Consistent with this assumption, superannuation fund participants were instructed to model the rapid termination of their largest banking relationship across deposits and wholesale debt exposures.

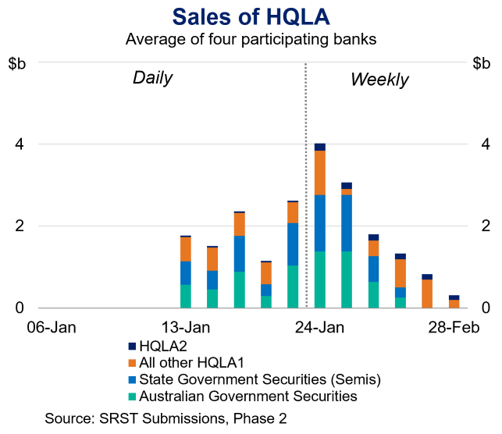
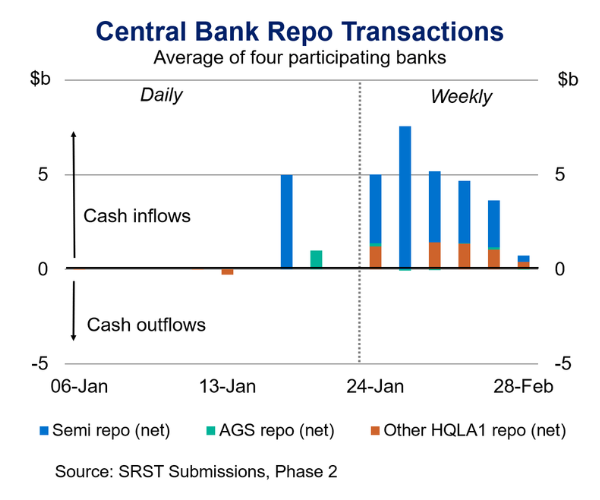
These conditions persisted for around two months. During this period, banks were required to manage severe liquidity pressure, relying on their existing stock of liquid assets and access to official liquidity facilities, in line with the scenario instructions. While broader liquidity stress was assumed to continue across the banking sector, large funding outflows were assumed to stabilise from around the start of month three.

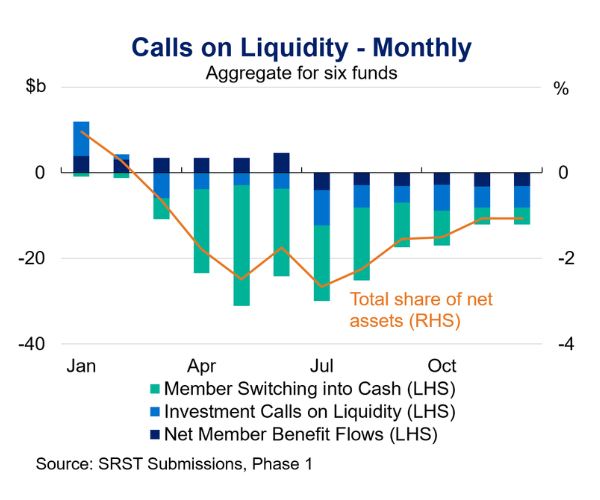
In Period 2 of the exercise (from approximately month four onwards), the primary focus was on the liquidity of superannuation funds.  The macroeconomic outlook deteriorated significantly. The Australian dollar depreciated, which shifted the movement of collateral flows from superannuation funds to other counterparties, generating stress for superannuation funds.  Superannuation funds experienced increased member switching into cash and lower‑risk investment options, alongside declining contributions and rollovers as economic conditions worsened. Liquidity conditions in private and unlisted markets deteriorated markedly, constraining funds’ investment flexibility. As the downturn progressed, member withdrawals increased, particularly among members above preservation age, and market liquidity remained subdued. Superannuation funds had to manage their liquidity and asset allocation in order to respond to these shocks.

By late in the scenario, the cumulative impact of economic weakness, market stress and funding constraints led to the expectation that banks would need to raise significant new equity to restore capital positions, culminating in large capital raisings toward the end of the scenario horizon. Superannuation funds had to model the extent of their participation in these capital raisings. 

Line chart comparing AUD/USD exchange rate and bank bill swap rate in the SRST scenario. AUD/USD (left axis) peaks near 0.85 in March then declines steadily, while bank bill swap rate (right axis) starts above 5%, decreasing sharply after March to about 2.5% by December.


Bar chart showing SRST scenario GDP growth forecasts from January 2025 to July 2027, with quarterly data bars declining from near 0% to nearly -1.5% by January 2026 and year-ended data points marked in blue dots showing a drop to about -2.5% in January 2026 and a recovery to 0% by July 2027.

Bank Liquidity Stress

An idiosyncratic funding run, driven by superannuation and financial institution customers, can have a severe effect on bank liquidity. Current prudential standards, APRA’s risk-based supervision, and banks’ prudent liquidity management practices help mitigate this risk.

Interpretation of bank results

Bank outcomes reflected the idiosyncratic nature of the liquidity stress, with each bank assuming it was subject to an individual shock. As such, it is important to recognise that results should not be aggregated.

The idiosyncratic liquidity shock banks faced in the SRST was severe. On average, banks modelled a decline in funding of about 15 per cent, or $170 billion. While there were some severe outcomes as measured by their Liquidity Coverage Ratio (LCR), all participating banks were able to withstand this shock. This resilience was underpinned by their high levels of liquidity, together with their capacity to monetise liquid assets through asset sales and use of liquidity offered by the Reserve Bank of Australia (RBA). Liquid asset balances fell sharply by the end of the liquidity stress period, but all banks remained liquid with significant liquid asset reserves.

Funding outflows

Banks modelled severe funding outflows, consistent with the scenario for this stress test. On average across banks, deposits from superannuation funds fell by almost 40 per cent over the liquidity stress period. Most superannuation fund deposits with participating banks were classified as non-operational deposits, primarily used for investment purposes. Operational deposits – those necessary for the day-to-day operations of funds – flowed out at a slower rate. Consistent with these results, APRA’s liquidity prudential framework requires significant amounts of liquidity to be held against these superannuation and financial institution deposits and differentiates between operational and non-operational deposits. At the start of the stress test, superannuation fund deposits averaged around $16 billion across bank participants, though these exposures were unevenly distributed across banks.

Line graph showing average superannuation fund deposits from four banks over two periods, with values in billions of dollars. Deposits decline sharply from about 16 billion in January to 10 billion by March, then stabilize around 10 billion through April.


Line graph showing average financial institution deposits of four banks from January to April, with values in billions of dollars. Deposits decline sharply from about $75 billion in January to around $45 billion in March (Period 1), then gradually increase to $50 billion by April (Period 2), with a vertical dashed line marking transition between periods.

Banks also modelled fast outflows in deposit funding from other financial institutions. On average, these deposits declined by 55 per cent over the liquidity stress period. This is a larger funding portfolio than direct superannuation deposits and is more evenly distributed across banks. Across participant banks, around two thirds of these deposits are non-operational. The financial institution deposit portfolio also includes some deposits which are indirectly owned by superannuation funds through their ownership of investment funds.

Collateral movements on financial market trades also reduced banks’ liquid assets, primarily due to the foreign exchange shocks in the scenario. These trades include FX forward hedge transactions, used to hedge client FX forward trades, and cross-currency interest-rate swap transactions, used to hedge offshore debt issuance. On average, banks experienced $15 billion of collateral outflows over the first two weeks of the scenario.

Superannuation fund submissions on deposits

A core feature of the SRST was gathering data on the stability of funding assumed by financial institutions on both sides of funding relationships. The below graph shows the range of speeds at which superannuation participants reported being able to withdraw deposits from their largest bank financial relationship.

On average, the modelled speed of deposit withdrawal was similar across industries, with just over 20 per cent withdrawn within a week and around 30 per cent within two months. However, superannuation fund responses varied widely: some funds withdrew less than 10 per cent of deposits from their primary bank, while others withdrew more than 50 per cent. Operational constraints, long‑standing relationships and financial‑stability considerations were cited as factors limiting withdrawals. Bank submissions on the speed of withdrawal also varied widely, reinforcing the uncertainty of how other participants might behave in stress that is a recurrent feature of the SRST.

Line graph showing withdrawal of deposits from largest bank relationship by superannuation funds, indexed to 100 in December 2024. It displays average super and bank submissions declining from 100 in January to around 70 and 60 respectively in February, with shaded area indicating range of super submissions.

Short-term bank debt

Negotiable certificates of deposits (NCDs) make up a significant share of banks’ domestic short-term wholesale funding. A significant share of banks’ NCDs are held by the superannuation industry, both directly and indirectly, via asset managers. NCDs are a type of short-term funding that are issued by banks, and can also be created when investors in certain deposit products, mostly notice‑period deposits, decide to convert them into NCDs. This conversion allows investors to make their holdings more liquid without immediately withdrawing funding from the issuing bank. In the scenario, banks modelled a material amount of these deposits converting into NCDs during the first two weeks of stress.

Bank responses to repurchase requests for NCDs varied, in line with differences in existing practices and investor cohorts. But, in general, during liquidity stress, banks declined to repurchase most converted NCDs, effectively requiring the investor to hold them to term. Some banks also declined to repurchase NCDs that were outstanding at the start of the scenario. Declining repurchase requests provides banks with some liquidity relief, as it allows them to retain cash until the maturity of the instrument.

Bar chart showing change in funding from negotiable certificates of deposit (NCDs) for four banks, divided into daily and weekly periods from January 6 to February 28. Chart uses stacked bars with colors representing deposit conversions, maturities, buybacks of other NCDs, buybacks of converted, and new issuance, highlighting a large spike in deposit conversions and buybacks around January 13.

Superannuation fund submissions on short-term bank debt

As with deposits, the SRST gathered data on superannuation funds’ investment actions around banks’ short-term debt, including negotiable certificates of deposits.

Only two of six funds participating in the SRST reported large holdings of the short-term debt of their main banking partners. The ownership of banks’ short-term debt is uneven across the industry, and many are held indirectly through investment managers.

In the first phase of the exercise, most superannuation funds expected to be able to request, and have granted, immediate buyback of their negotiable certificates of deposits, by the issuing bank. There was some recognition by superannuation funds that this is not required under the contractual terms of this instrument, although this recognition was not widespread in superannuation submissions. Funds with assumptions on the liquidity of these instruments which more closely aligned to their contractual terms – and the behaviour banks projected in this exercise – generally had lower holdings of NCDs.

Bank liquidity management actions

Banks responded to the liquidity shock using a range of monetisation strategies, rather than relying on a single source of liquidity.

Banks drew on a mix of central bank facilities, exchange settlement balances and market-based monetisation of assets, with choices influenced by relative cost, operational considerations and market conditions. Across banks, usage was broadly balanced across these channels.

Sales of liquid assets

Sales of high-quality liquid assets (HQLA) commenced in week two of the scenario, as banks began reacting to the idiosyncratic liquidity stress. Banks sold an average of $8 billion of HQLA in this week. Sales continued in later weeks, but, on average, at lower volumes. Banks sold a roughly equal mix of Australian Government Securities (AGS) and State Government Securities (semis). Some banks also sold other HQLA securities, mainly government bonds issued by large, advanced economies, in order to meet outflows in these jurisdictions. For the two months of the liquidity stress, banks sold an average of $20 billion of liquid securities. The capacity of markets to absorb asset sales under stress is inherently uncertain.

Bar chart showing average daily and weekly sales of HQLA by four banks from January 6 to February 28, with categories including HQLA2, other HQLA1, State Government Securities (Semis), and Australian Government Securities. Sales peak around January 24, with Australian Government Securities and HQLA2 contributing most to the highest weekly sales near $4 billion, followed by a decline through February.

Reliance on RBA liquidity facilities and balances

Most banks made significant use of RBA liquidity facilities, undertaking large scale repos predominantly using semi-government securities as collateral. These started during week two of the stress, with the largest volume in week three. Banks continued to undertake large-scale new borrowing from the RBA until week seven. Banks undertook, on average, around $27 billion of AGS and semis repo with the RBA. All of this borrowing was done as part of the RBA’s normal open market operations, in line with the stress test assumption of no use of Exceptional Liquidity Assistance.

Banks hold large deposit balances with the Reserve Bank of Australia, as part of their liquidity management and to meet their obligations, as part of the payments system. On average, these balances fall by more than half as a result of the liquidity stress. Changes in these balances are the net result of the changes in funding, liquid asset sales, repo, and other liquidity management actions.

Bar chart showing Central Bank Repo Transactions for four banks from January 6 to February 28, with cash inflows and outflows measured in billions of dollars. The chart uses blue, green, and orange bars to represent semi repo, AGS repo, and other HQLA1 repo net values, highlighting a peak in weekly semi repo inflows around late January followed by a decline into negative territory by late February.


Line graph showing ESA balances for four banks from January to March, divided into Period 1 and Period 2. Balances decline from around $50 billion in January to about $20 billion in early March, then rise steadily to nearly $30 billion by the end of March.

Actions in private repo markets

Some banks allowed large private reverse repos to unwind at the start of the liquidity stress – that is, they reduced the repo lending they undertake.3 This action causes an inflow of cash to banks’ Exchange Settlement Accounts (ESA) and an outflow of securities. On average, across participant banks, this action led to an inflow of $45 billion into ES accounts, about half attributable to AGS and semis. Notably, some banks also modelled large reductions in their private repo borrowing early in the stress, as counterparties withdrew this financing, including for borrowing backed by foreign HQLA. Most private repo counterparties for these banks are large global banks, as well as domestic fixed income asset managers. This reduction in private repo financing provided by banks could cause some short-term friction and disruption for counterparties, particularly domestic asset managers or offshore hedge funds.

Reducing lending and asset sales

All participating banks indicated they would aim to reduce new lending, and sell some assets, in response to the severe idiosyncratic stress imposed by the SRST scenario. Bank submissions in Phase 1 indicated an average reduction in lending assets over the year of the scenario of around $50 billion, which is about one per cent of total credit in Australia. Banks’ written submissions provided some detail on portfolios and sectors where reductions in lending would be prioritised. These include not refinancing or not financing new corporate and large business loans, particularly offshore loans, and trade finance. Several banks also suggested they would pursue selling small volumes of mortgages.

Superannuation Fund Liquidity Stress

Superannuation funds met severe liquidity pressures largely by selling offshore listed assets. While avoiding unlisted asset sales helped limit fire‑sale losses, it increased unlisted asset exposure for some members, as portfolios became less balanced.

In superannuation, liquidity risk refers to the risk that funds are unable to meet their existing or prospective cashflow and other financial liabilities in a timely manner, without resorting to disorderly asset sales or actions that adversely affect member outcomes. At a system level, if liquidity stress was widespread across the industry, disorderly asset sales could have destabilising impacts on some financial markets. Stress could in turn transmit to other market participants and to the real economy through impacts on household wealth and consumption and through business investment. The SRST examined liquidity risk by considering the interplay between demand or calls on liquidity that funds and the system face, relative to the available supply of liquid assets.

Demand for liquidity (calls on liquidity)

Calls on liquidity represent the various components making up the total demand for liquidity that a superannuation fund (or the superannuation system) may face over a given period. Participating funds modelled severe liquidity stress under the SRST scenario, with aggregate monthly liquidity calls peaking at around $30 billion and cumulative demands totalling $174 billion, or just under 16 per cent of net assets.

Bar chart showing monthly calls on liquidity for six funds, with data from January to October. It displays three stacked components in shades of blue and green representing member switching into cash, investment calls on liquidity, and net member benefit flows on the left axis in billions, alongside an orange line indicating total share of net assets on the right axis in percentages, highlighting a downward trend in net assets reaching nearly -3% mid-year before slightly recovering.


Stacked area chart showing cumulative calls on liquidity for six funds from January to October, with values in billions of dollars on vertical axes. The chart highlights increasing negative flows from members switching into cash (green area) and investment calls on liquidity (blue area), resulting in a net member benefit flow (dark blue area) that peaks around mid-year before declining.

Demands on superannuation funds to generate liquidity in the SRST scenario arise from three sources: member switching into cash, investment related liquidity calls, and net member benefit flows.

1. Member Switching to cash

The largest contributor to the liquidity shock was member switching from non-cash options into cash options. Member switching activity in the SRST amounted to between about 8 per cent and 15 per cent of net assets of funds, varying based on the different member profiles and investment mix at each fund. Average daily member switching peaked in month 5, slightly exceeding most funds’ COVID 19 experience. However, elevated switching persisted for longer resulting in a significantly greater cumulative impact.

2. Investment calls on liquidity

Investment‑related liquidity flows were primarily composed of derivative margining and foreign‑exchange settlements, with smaller calls from existing capital commitments. These calls totalled around $40 billion across the six funds, representing just under 4 per cent of net assets. While superannuation funds received cash inflows over the first two months of the scenario from foreign-exchange (FX) derivatives as the AUD appreciated, these flows turned negative as the AUD depreciated and the sell-off in equity markets accelerated.

Bar chart showing investment calls on liquidity aggregated for six funds from January to October. It uses stacked bars with colors representing expenditure, capital calls, FX settlements, and derivative margining, highlighting a shift from positive liquidity in January to consistent negative liquidity from April onward.


Bar chart with line graph showing aggregate net flows per month for six funds, titled "FX Derivative Margin & Settlement." Dark blue bars represent Derivative Margining and light blue bars represent FX Settlements on the left y-axis in billions, while an orange line shows AUD/USD exchange rate on the right y-axis; notable trends include a peak in net flows and AUD/USD around December to February, followed by a steady decline through December.

Funds reported a variety of measures to manage FX hedging risks, including use of short-dated instruments, closing positions before expiry, monitoring out of the money positions, stress testing and cashflow modelling. Growing offshore investments will increase the importance of foreign currency risk management in the future and may expose funds to increased collateralisation which would increase operational requirements and change risk profiles.

3. Net Member Benefit Flows

Member benefit cashflows declined significantly over the stress period from a range of shocks prescribed in the scenario. This included a moderation in net-rollovers, a decline in contribution inflows occurring from month three onwards, and a significant increase in lump-sum withdrawals out of superannuation accounts by members over preservation age occurring from month seven onwards. The shocks to member benefit cashflows meant that when facing increased member switching and investment calls, funds could not rely on strong cash inflows to help meet their liquidity requirements.

Line graph showing net member benefit flows for six funds from January to October. Amount in billions (left axis) remains positive around 3-4 until a sharp drop below -4 in July, while share of net assets percentage (right axis) follows a similar trend, declining from about 0.3% to around -0.3%.

The lump-sum withdrawals caused by this SRST shock were around twice as large as the COVID-19 Early Release Scheme for the median fund. As this withdrawal shock applied to a different cohort of members – withdrawals under the COVID-19 ERS were predominately by younger members – the relative impact by fund was different depending on their member characteristics. This enabled APRA to observe the impact across funds of a different kind of shock.

Supply of liquidity

The available supply of liquidity represents the holdings of cash and the holdings of other assets that can be easily and quickly sold by superannuation funds and converted into cash. Broadly, these can be broken into two categories – investments and cash products.

1. Investments

Superannuation funds hold significant amounts of liquid assets. In aggregate, at the commencement of the scenario the six funds participating in the SRST held approximately $600 billion in domestic and $560 billion in international equities, equating to a combined 56 per cent of their total investments. At the start of the scenario, superannuation funds assumed that approximately 41 per cent of median investments could be converted into cash within three days, just under 52 per cent within one week and 65 per cent within one month.

Pie chart showing asset allocation for six funds as of December 31, 2024, with Listed Equity comprising the largest portion at 56%, followed by Other (Unlisted) at 23%, Fixed Income at 13%, Cash at 5%, and Credit at 4%. Colors include dark blue for Listed Equity, mustard yellow for Other (Unlisted), orange for Fixed Income, blue for Cash, and teal for Credit, with percentage labels inside each segment.


Line chart showing liquidity profile of investments with median share redeemable to cash over one year from December to December. Three lines represent liquidity within 3 days, 7 days, and 30 days, with percentages declining slightly over time, starting around 65% for 30 days, 50% for 7 days, and 40% for 3 days.

* Other investments includes unlisted equity, property, infrastructure and alternatives.

Funds reported a range of portfolio liquidity assumptions, in some cases differing significantly despite holding similar asset class exposures. In Phase 1 of the exercise, some funds reported portfolio liquidity assumptions that were far in excess of what domestic equity markets could likely absorb in times of stress. Some funds resubmitted portfolio liquidity metrics in the Phase 2 of the exercise in response.

2. Cash products

Superannuation funds include a range of products within their cash asset classes, including cash at bank, NCDs and term deposits. These cash instruments have different liquidity contractual terms and may not be available immediately to provide liquidity. In aggregate, funds reported that 53 per cent of their total cash holdings were available within three days with this rising to 76 per cent within one month.

Bar chart showing superannuation fund cash components for six funds totaling billions of dollars as of December 31, 2024. Four categories—Cash At Bank, Negotiable Certificates of Deposit, Cash Term Deposit, and Cash Short Term Bank Bills or Securities—are represented by dark blue horizontal bars, with Cash At Bank being the largest component near 40 billion and Cash Short Term Bank Bills the smallest under 10 billion.


Bar chart showing liquidity profile of cash for six funds as of December 31, 2024, with percentages on the vertical axis and time intervals on the horizontal axis. The chart highlights over 50% of cash liquid within less than 3 days, followed by 16% greater than 90 days, 14% between 4 to 7 days, and smaller amounts in 8 to 30 days and 31 to 90 days categories.

Most funds reported that holdings of NCDs are highly liquid and generally redeemable to cash in less than three days, despite issuing banks having the contractual ability to refuse buy-back requests and limited market depth in secondary markets. Bank responses to repurchase requests varied, and some banks did not accept buy-back requests when faced with their own liquidity stress.

Actions superannuation funds took in response to the stress

Superannuation funds were able to generate sufficient cash during the SRST scenario to meet the member and investment liquidity outflows. Aggregate calls on liquidity per month peaked (were at their worst) at less than 7 per cent of available liquid assets over a month.

Funds met liquidity demands using a combination of existing cash and asset sales. While cash provided an initial buffer, most liquidity was generated through substantial sales of offshore listed equities, which trade in deep and liquid markets. The AUD value of offshore assets received support from the depreciation of the Australian dollar in the second period of the scenario, which also informed the decision to reduce exposures to international assets. In aggregate, funds sold $81 billion in equities and $11 billion in fixed income assets over the scenario.

Bar chart and line graph combination showing calls on liquidity versus liquid assets from January to December. Dark blue bars represent assets available within the month, light blue bars show calls on liquidity, and an orange line indicates calls as a share of assets available, peaking around mid-year before declining.


Bar chart showing net transactions aggregated for six funds from January to December, with values in billions of dollars on vertical axes. The chart uses blue for cash, orange for fixed income, dark blue for equity, and yellow for other categories, highlighting positive cash inflows and negative equity outflows, with fixed income fluctuating mostly below zero in later months.

Funds largely avoided selling unlisted assets to meet liquidity needs, limiting the transmission of selling pressure into domestic asset markets. However, some funds indicated they would reduce or defer new capital commitments to private credit and private equity, which could increase pressure in those segments. Sales of domestic equities were generally modest and likely to have been absorbed by the market. However, the significant volume of transactions required by funds to meet their liquidity demand, combined with their preparedness to pull back from private market commitments (even if temporarily), illustrates the potential for their responses to destabilise asset markets. This risk would be greater if such transactions were concentrated in domestic rather than international markets.

All funds were reluctant to sell unlisted (illiquid) assets to rebalance portfolios during the scenario, even as liquidity stress peaked and their own internal risk metrics and thresholds indicated high liquidity stress on their portfolios. They expressed a strong desire to avoid generating additional losses for members, as selling illiquid assets during periods of market stress may involve taking additional haircuts on valuations. However, the absence of rebalancing had a significant impact on portfolio asset allocations, with the proportion of unlisted assets increasing materially.

Bar chart showing percentage point changes in asset allocations across six funds during an exercise. Cash increased by 13.9 points, equity decreased by 16.0 points, while infrastructure, credit, alternatives, and fixed income showed minor positive changes, and property slightly declined by 0.5 points.


Line chart showing illiquid assets as a share of total investments over one year, with median values rising from about 35% in December to nearly 50% the following December. Shaded area represents interquartile range, indicating variability between roughly 30% and 55%, highlighting increasing concentration of illiquid assets over time.

Implications for member outcomes

The stress conditions in the SRST had a material impact on members. Investment losses in the scenario resulted in a significant decline in average member balances over the twelve-month period, by around 25 per cent for the median fund.

Allocations to illiquid assets in MySuper options (the default option for members) increased substantially compared to the change in other investment options for most funds. While this supported fund‑level liquidity management and helped avoid crystallising further losses on illiquid assets, it shifted a greater share of liquidity and sequencing risk onto MySuper members, particularly toward the end of the stress scenario.

The SRST results highlight the potential risks of this liquidity management approach, particularly if economic conditions were to weaken further and a recovery in unlisted asset prices did not materialise. It also reinforces the importance of having robust valuation policies to support fair and appropriate member outcomes.

Line chart showing share of unlisted investments for two categories, "My Super" and "Other," from December to December. "My Super" increases steadily from about 29% to 37%, while "Other" remains relatively flat around 17%.

To help address member equity considerations, two funds reported widening or considering introducing ‘buy-sell spreads’ for member switching between options.

Outage of Material Service Provider

The impact of financial shocks can be greater when they occur concurrently with operational risk events or disruption at a material service provider, underlining the need for operational resilience and preparedness.

Operational Risk Scenario

The operational risk shock in the SRST was an additional scenario that participants were required to model. The operational risk scenario added a short‑lived disruption in week two, involving an outage of a material service provider that temporarily prevented settlement of debt securities transactions. Settlement was suspended for the final three working days of the week while records were restored, with normal operations resuming at the start of week three.

Banks

The outage intensified acute liquidity stress by preventing banks from transacting in a large share of their liquid asset holdings, delaying asset sales and repo activity until service provider operations resumed. During the disruption, banks relied more heavily on ESA balances to meet outflows, with average balances falling by around $11 billion more than in the baseline scenario. In some cases, the outage also led to greater use of central bank facilities in subsequent weeks.

Impacts varied across banks, reflecting differences in funding profiles and starting liquidity positions. Banks facing more severe early outflows were more affected, while higher initial ESA balances allowed some banks to withstand the disruption for longer. Had a similar outage occurred later in the stress period, impacts would likely have been more severe as liquidity buffers had already been eroded.

Line graph showing ESA balances for four banks from January to February, comparing baseline and operational risk scenarios. Baseline scenario starts near $45 billion and declines steadily to about $25 billion, while operational risk scenario begins around $40 billion, dips sharply, then gradually decreases to just above $20 billion.

Superannuation funds

Superannuation funds were only modestly affected by the outage at the common material service provider, largely reflecting its timing early in the scenario and their limited reliance on the segment as a primary source of liquidity. Superannuation funds delayed their transactions of securities until the services reopened. This prolonged their exposure to their primary bank suffering an idiosyncratic shock.

Operational preparedness

Although the prescribed scenario did not force banks and superannuation funds to adopt alternative trading methods, participants proposed a range of possible alternatives they could utilise under a more severe outage. For superannuation funds, these included withdrawals of bank deposits, obtaining synthetic derivative exposures, liquidating international assets, deferring settlements, or trading without settlement. Banks could borrow from the interbank cash market or from offshore markets. Many of these proposed alternatives introduce additional risks, such as requiring participants to take on more counterparty credit risk or potentially amplifying spillovers of liquidity stress between participants. For banks, there was uncertainty around how these alternatives would be used in the context of an idiosyncratic stress.

Superannuation funds also had relatively limited direct visibility over the disruption. As they are not direct participants of the service provider, superannuation funds typically rely on their custodian or external managers to access the facility. This, in turn, limited superannuation funds’ ability to assess the potential member impact, such as delays to switching and redemption activity or increased market volatility. These findings suggest there is a need for further maturity of superannuation funds’ operational risk capabilities.

More broadly, the operational risk scenario in the SRST highlighted that preparedness for non-financial shocks, such as key service provider failure, is an important component of an entity’s overall resilience. Even a short-lived outage can materially amplify liquidity stress, as the exercise exposed uncertainties in both impact and response. Entities should also recognise that they are participants in a broad and increasingly interconnected financial system and would benefit from maintaining visibility over market participants outside of their direct operational purview.

Bank Recapitalisation During System Stress

A deep domestic pool of capital provides a counter-cyclical stabiliser for the banking system and the economy. This is particularly important as geopolitical fragmentation increases the risk of disruption to international funding markets.

The SRST scenario required all banks to raise a minimum prescribed share of capital, and detail potential sources and market dynamics.

To attract investor participation, banks modelled capital raisings at significant discounts to market prices. These discounts were similar to historical capital raising in stressed conditions, and reflected the conditions in the second period of the scenario - including a broader economic downturn, simultaneous capital raising by multiple banks, ratings downgrades, and limited underwriting capacity. These discounts were compounded by sharp declines in bank share prices earlier in the scenario.

Banks generally assumed that superannuation funds continued to be a material provider of capital despite market conditions and superannuation fund liquidity stress. Banks assumed superannuation funds would participate in capital raisings on a pro‑rata basis, primarily taking up entitlements rather than increasing ownership positions. Given their large existing holdings of bank equity, this is still a substantial amount. In aggregate, banks expected superannuation funds to contribute around $4 billion out of total capital raisings of approximately $40 billion, with the remaining issuance assumed to be absorbed by other domestic and offshore investors.

Superannuation funds’ modelled participation exceeded banks’ own expectations, highlighting their importance as a domestic source of capital under stress. Despite facing their own liquidity pressures, participating funds projected aggregate contributions of around $7 billion. Some funds indicated participation could be funded through sales of other Australian listed equities.

Most superannuation funds participated on a pro‑rata basis, with only one fund indicating a higher level of participation. Several funds noted that investment decisions would be taken by external investment managers rather than trustees and would ultimately depend on prevailing market conditions and portfolio considerations, with a focus on members’ best financial interests. The participating funds also generally had a higher share of internally managed investments than the broader industry. This suggests that funds with greater reliance on external mandates may face additional constraints in adjusting investment positions under stress. The exercise highlighted that systemic financial stability considerations are not typically an explicit input into investment decisions. Therefore, while members’ long‑term interests may align with broader system stability, this alignment cannot be assumed in all scenarios or across all member cohorts.

Bar chart showing bank capital raisings by investor type, divided into total raised from bank submissions and super participation from super submissions.

Finally, the contribution observed from superannuation funds in the SRST understates the role of the industry as a whole. Some participation by domestic asset managers is likely to reflect investment on behalf of superannuation funds, and the six participating funds account for around half of total superannuation assets. Scaled to the broader industry, aggregate contributions could potentially be materially larger.

Footnotes

  • 1

    Australian Government Treasury, Information Note, 2025-11, The superannuation system in aggregate.

  • 2

    See APRA’s May 2026 System Risk Outlook for more detail on these financial links.

  • 3

    Reverse repos involve the purchase of securities with the undertaking to reverse the transaction at an agreed price and date in the future.