

Key metrics
Hospital treatment membership
General Treatment membership
Hospital treatment episodes
General treatment services (ancillary)
Benefits
Out- of -pocket per episode/service
Membership and coverage
Hospital Treatment
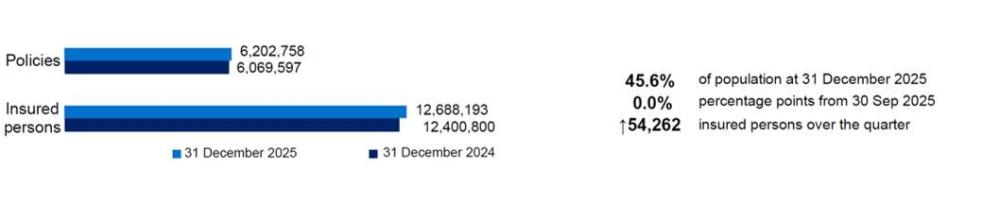
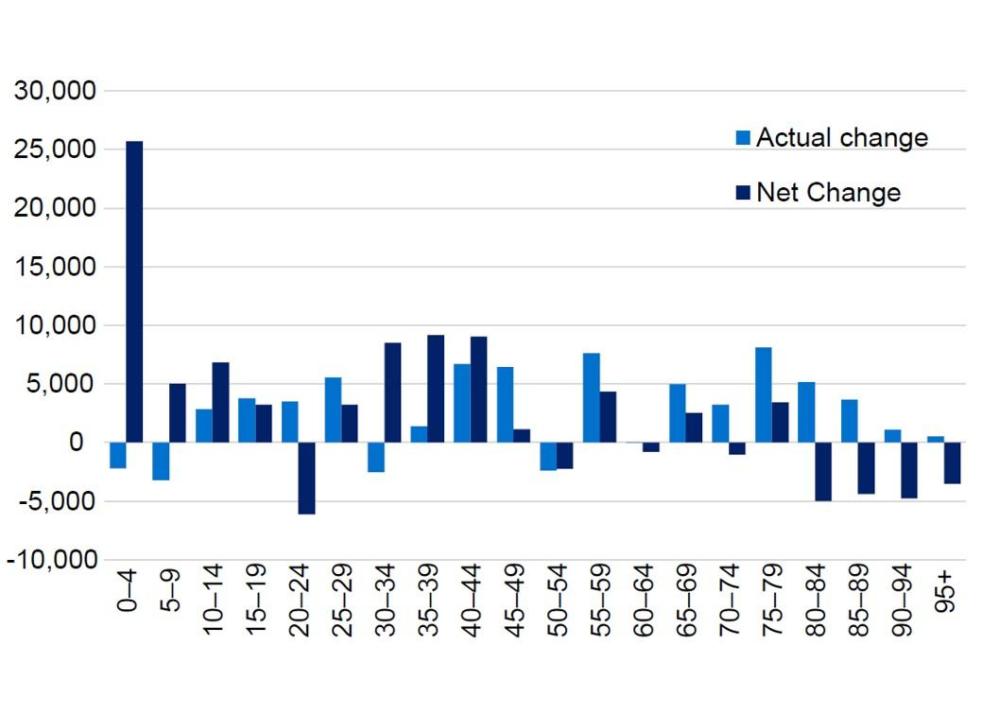
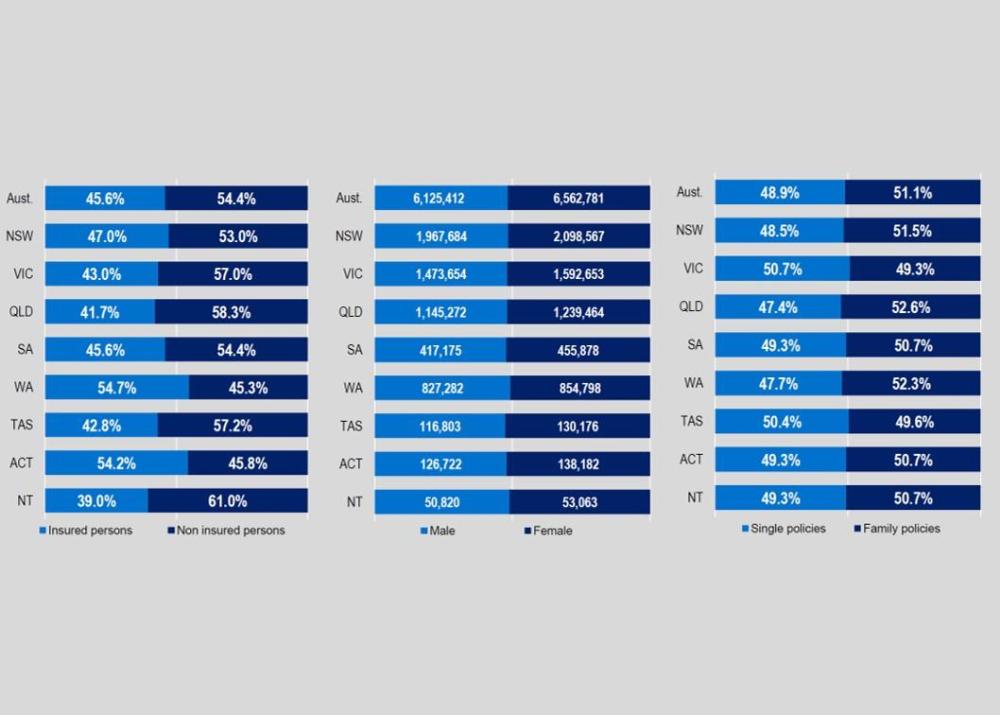
At 31 December 2025, 12,688,193 people, or 45.6% of the population, were covered by hospital treatment cover. There was a slight increase compared to September 2025. There was an increase in coverage of 54,262 insured people in the December 2025 quarter compared to September 2025. Family policies increased by 7,028 and single policies by 12,253 during the quarter. The largest increase in coverage during the quarter was 8,102 for people aged between 75 and 79.
The largest net increase (taking into account movement between age groups) was for the 0-4 with an increase of 25,668 people.
Net quarterly change in insured persons
Lifetime health cover
The majority of adults with hospital cover (87.2%) have a certified age of entry of 30, with no LHC loading.
At the end of the 31 December 2025 quarter, there were 1,165,332 people with a certified age of entry of more than 30 and subject to a Lifetime Health Cover loading: a net increase in people paying a penalty over the preceding 12 months of 78,833. There was a net increase in people with a certified age of entry of 30 (with no penalty) over the year of 87,479. Over the year, 89,893 people had their loading removed after paying a loading for ten years.
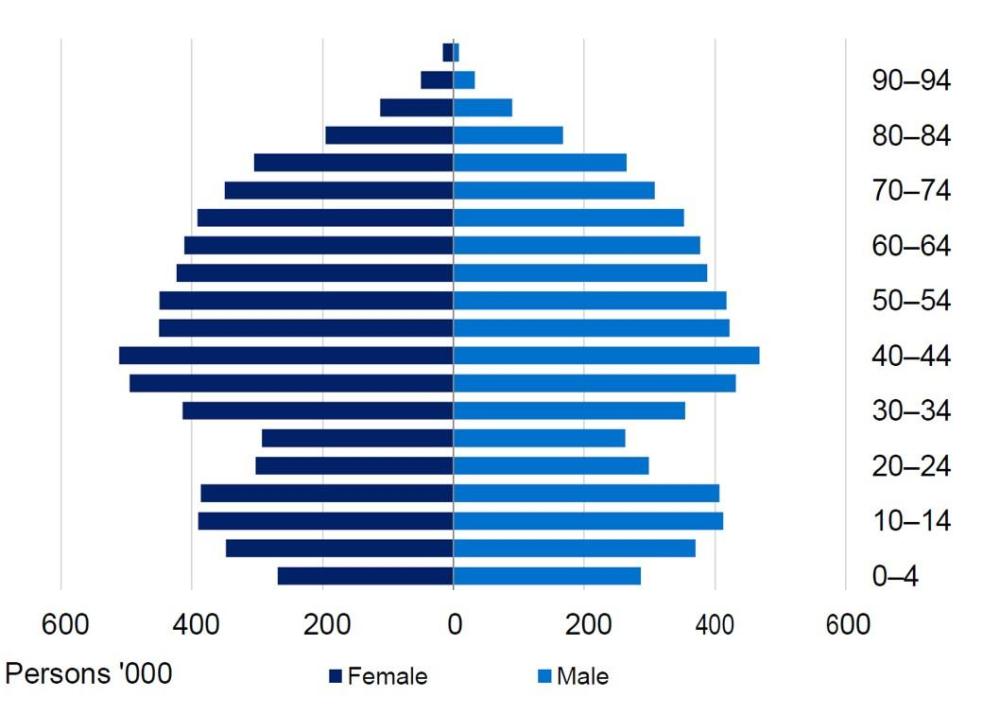
Number of persons insured by age
Hospital treatment tables
General Treatment
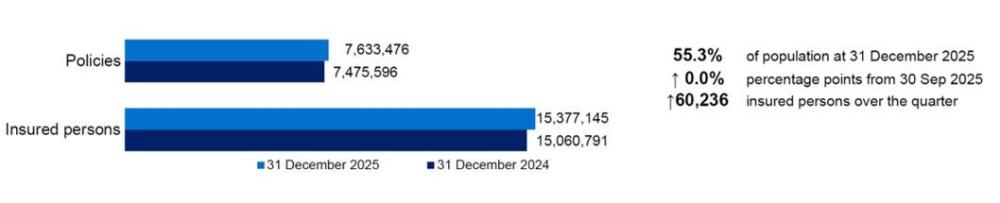
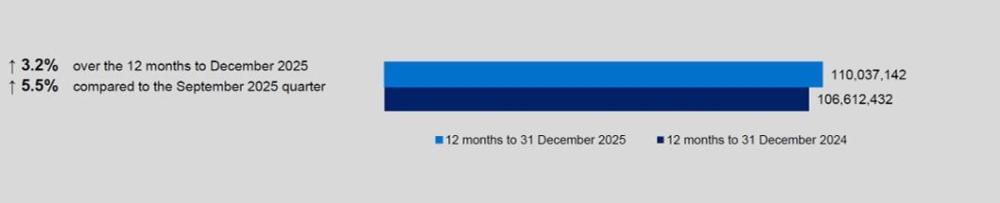
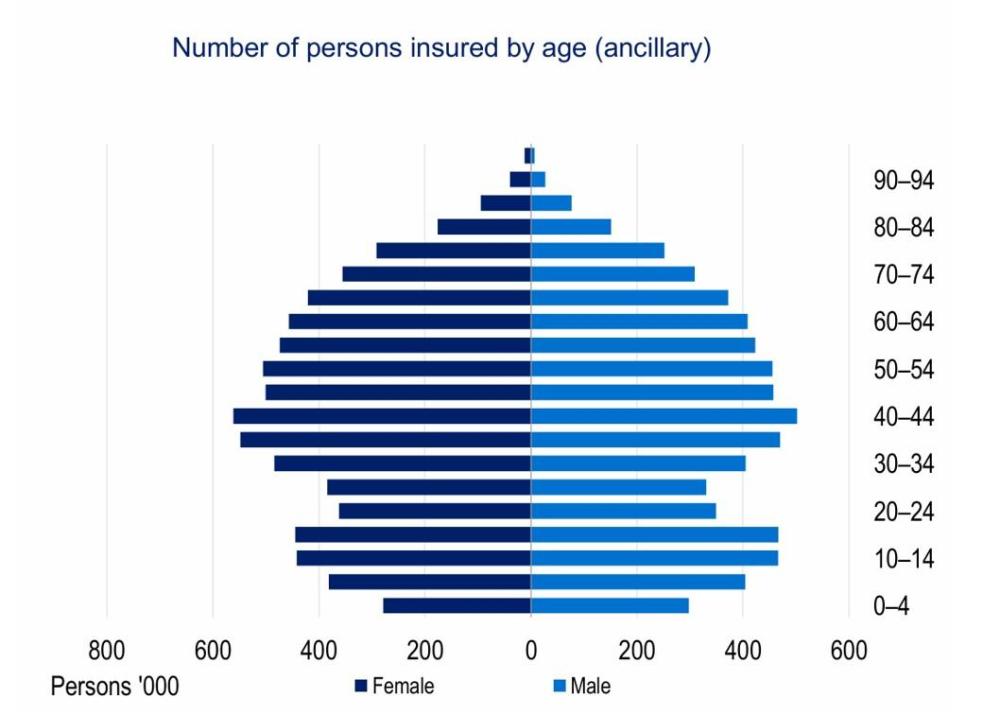
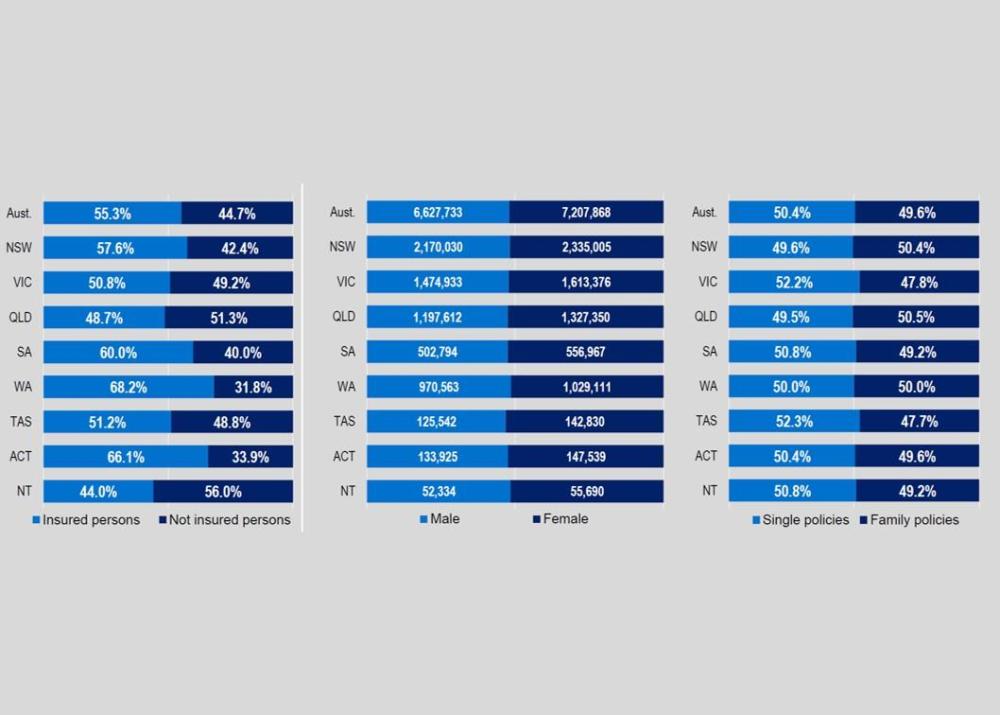
At 31 December 2025, 15,377,145 people or 55.3% of the population had some form of general treatment cover. There was an increase of 60,236 people when compared to the September quarter. There was an increase of General Treatment policies of 32,590 for December 2025 which was mainly driven by Single Policies which increased by 18,201. For the 12 months to 31 December 2025, the number of insured persons with general treatment cover has increased by 316,354.
The general treatment (ancillary) by age charts and data in this report show data for those people that have general treatment policies covering ancillary services, regardless of other treatment included in the product. This excludes those general treatment policies that do not cover ancillary treatment.
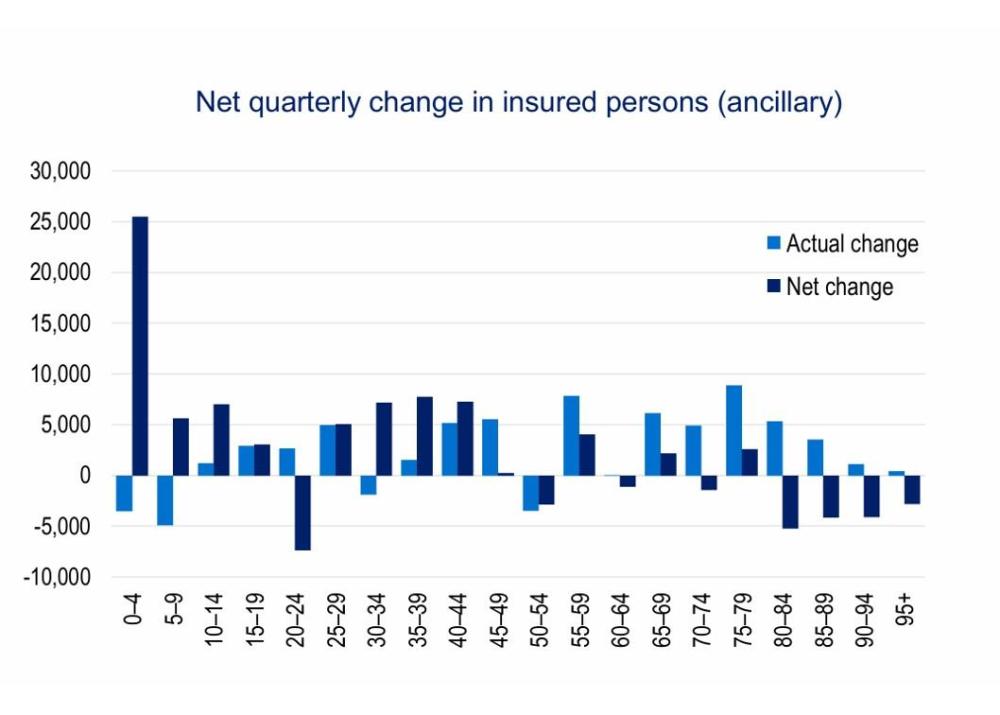
There was an increase of 48,314 people with general treatment (ancillary) coverage in the December 2025 quarter. The largest net increase in coverage, after accounting for movements across age groups, was 25,487 for people in the 0 to 4 age group.
Net quarterly change in insured persons (ancillary)
Number of persons insured by age (ancillary)
General treatment tables (ancillary)
Benefits Paid
Hospital treatment
Benefits per episode/service
| Hospital treatment | December 2025 | Change from September 2025 |
|---|---|---|
| Acute | $2,868 | 1.0% |
| Medical | $70 | 2.6% |
| Medical devices or human tissue products | $665 | 1.3% |
| Cardiac | $3,102 | 1.0% |
| Hip | $1,656 | 1.2% |
| Knee | $1,670 | -0.1% |
Total benefits and growth rate
| Hospital treatment | December 2025 | Change from September 2025 |
|---|---|---|
| Hospital | $5,359,059,230 | 2.9% |
| General | $1,813,546,622 | 7.4% |
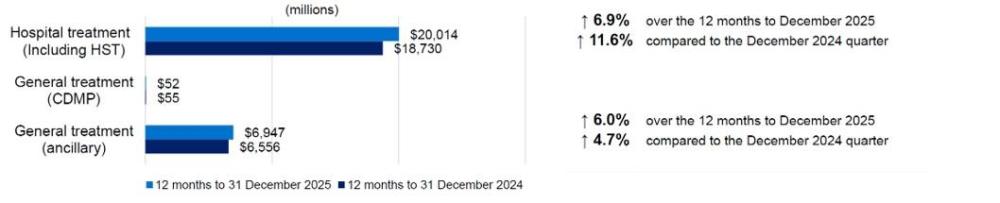
During the December 2025 quarter, insurers paid $5,359.06 million in hospital treatment benefits, which was 2.89% increase compared to the September 2025 quarter. Hospital treatment benefits were comprised of:
- $3,917.82 million for hospital services such as accommodation and
nursing - $765.17million for medical services
- $676.06 million for medical devices or human tissue items.
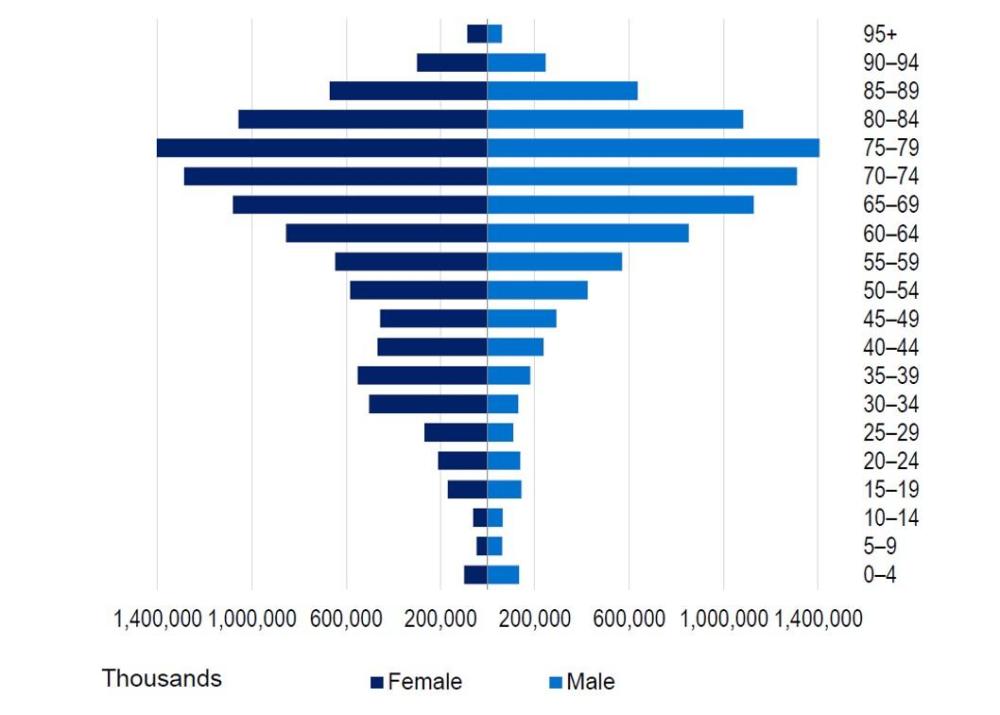
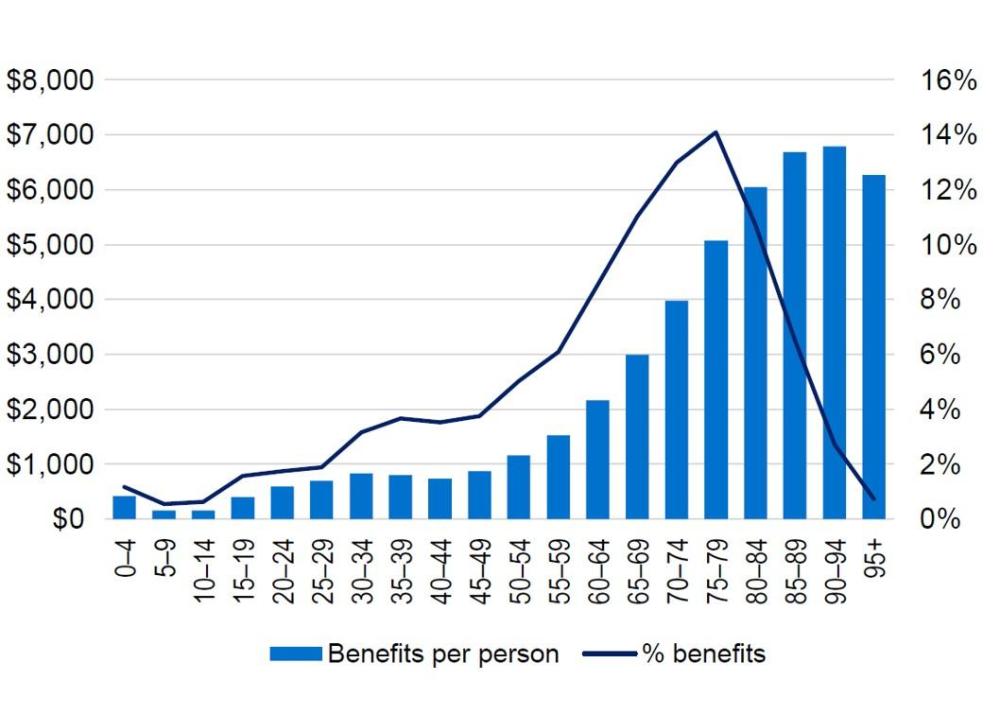
The age group for which most hospital benefits are paid is between 75 and 79 (top chart). Total benefits by age group is affected by the average benefits paid per person (displayed in the second chart) and the number of people in each age group.
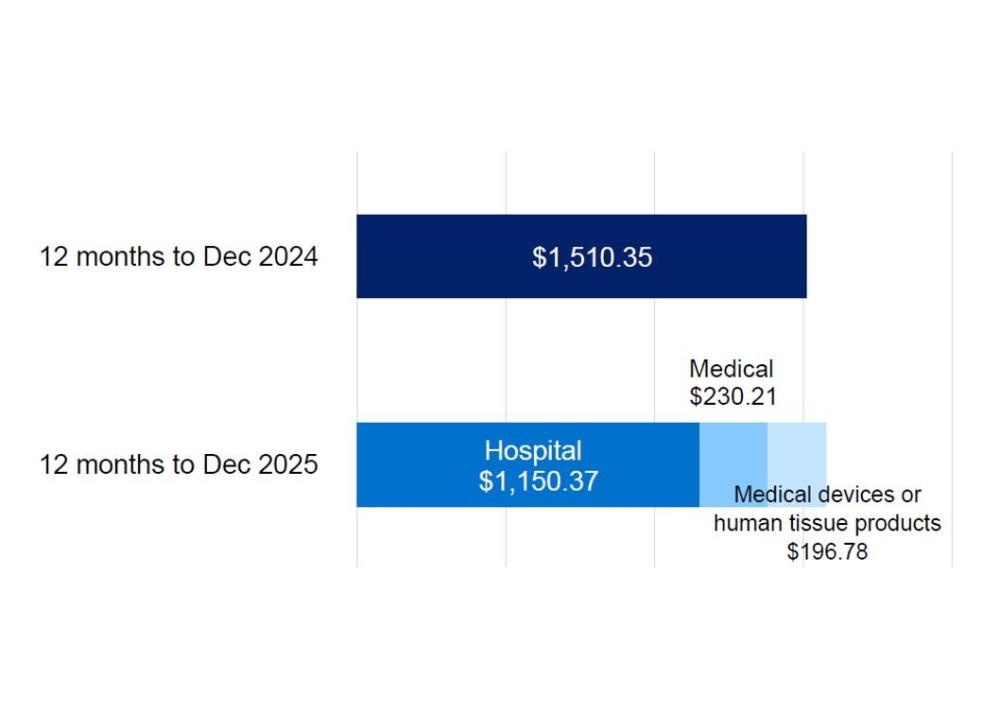
Average hospital benefits per person increased from $1,510.35 for the year ending December 2024 to $1,577.36 for the year ending December 2025. The largest amount of benefits per person was spent on hospital accommodation and medical, followed by medical services and then medical devices or human tissue benefits.
Hospital treatment benefits paid by age 12 months to 31 December 2025
Hospital treatment benefits per person covered and percentage of benefits paid by age cohort
Hospital treatment benefits per person
General treatment
Benefits per service
| - | December 2025 | Change from September 2025 |
|---|---|---|
| Dental | $68 | 0.4% |
| Chiropractic | $34 | -2.3% |
| Physiotherapy | $42 | -0.2% |
| Optical | $84 | 0.3% |
During the December 2025 quarter, insurers paid $1,802.02 million in general treatment (ancillary) benefits. This was an increase of 7.7% compared to the September 2025 quarter. Ancillary benefits for the December 2025 quarter included the major categories of:
- Dental $989.93 million
- Optical $327.24 million
- Physiotherapy $117.83 million
- Chiropractic $68.36 million.
There is a marked difference between the distribution of benefits over age groups between hospital benefits and ancillary benefits. The major difference is the higher claiming rate in older age groups for hospital benefits while benefits per person for ancillary benefits are more evenly spread over the age groups.
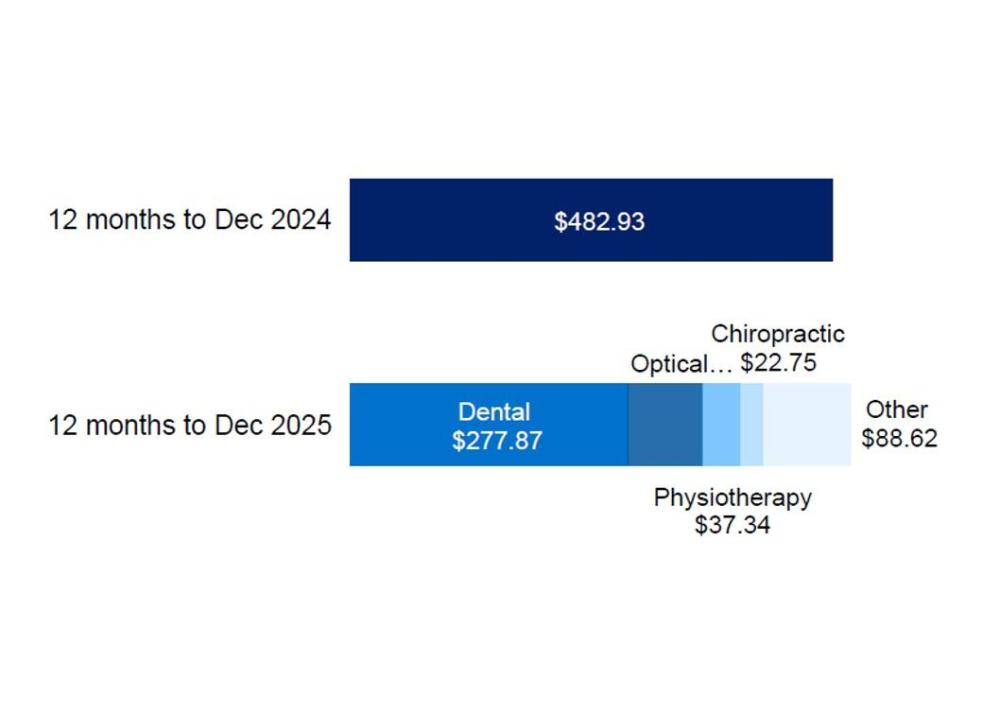
General treatment (ancillary) benefits per person during the year to December 2024 were $482.93 increased to $502.08 for the year to December 2025. The largest component of ancillary benefits is dental, for which $277.87 was paid per insured.
General treatment benefits paid by age 12 months to 31 December 2025 (ancillary)
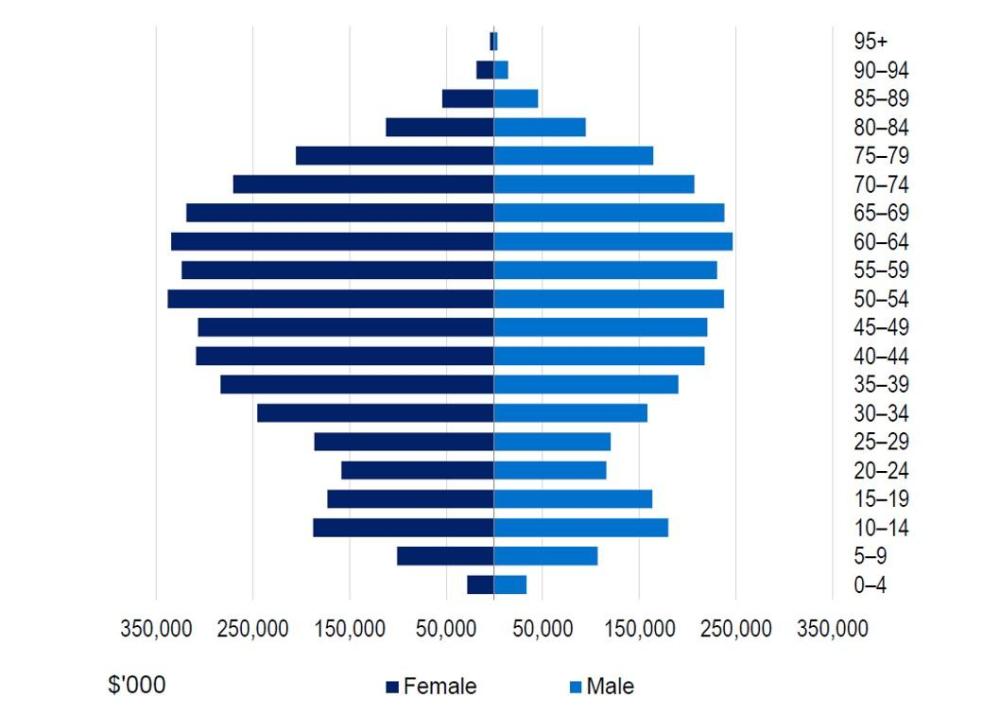
General treatment benefits per person covered and percentage of benefits paid by age cohort (ancillary)
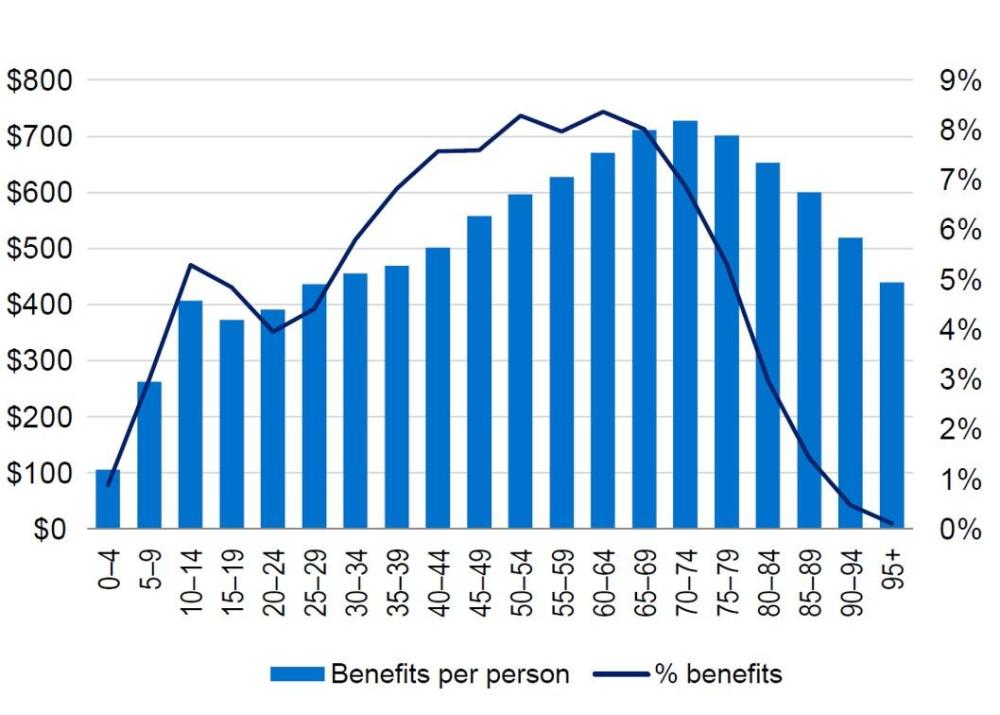
General treatment benefits per person (ancillary)
Medical benefits
Total benefits for medical services decreased by 0.8% during the December quarter 2025.
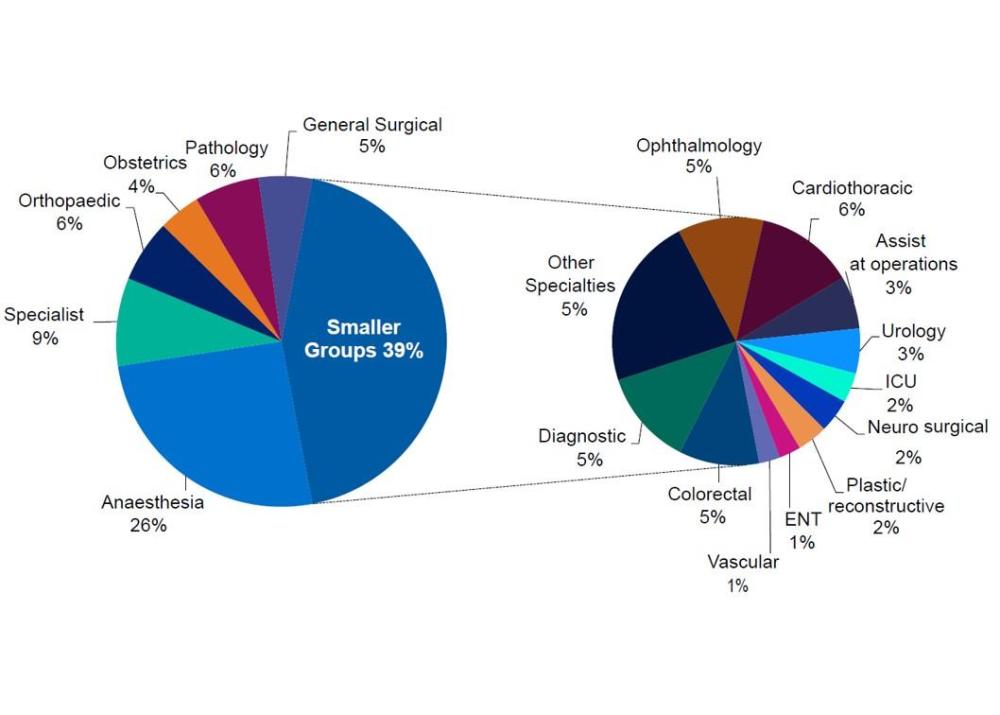
The change in medical benefits paid per service was calculated over a range of medical services and does not mean medical services overall decreased or increased in cost. The average benefits paid reflects the type of medical services utilised during the quarter as well as the volume of services. The medical service for which the greatest amount of benefits was paid was anaesthetics, comprising 25.4% of all medical benefits and totalling $196.02 million.
Medical devices or human tissue benefits
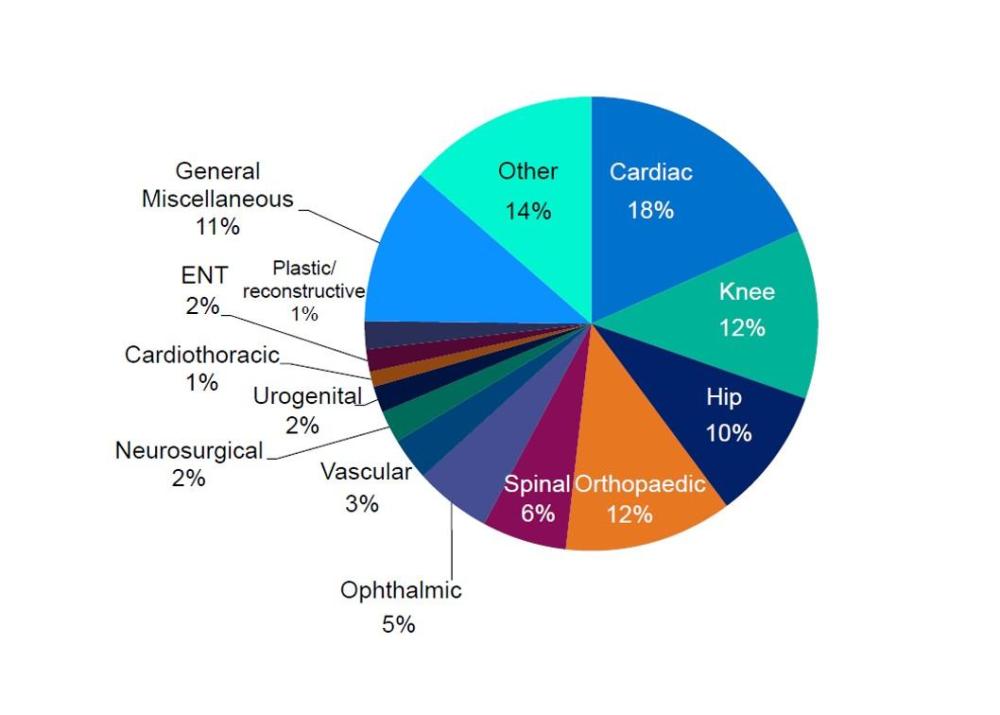
Total benefits paid for medical devices or human tissue products increased by 5.6% in December 2025 compared to September 2025. Similar to medical services, the change in benefits paid for medical devices or human tissue products was calculated over a range of medical devices or human tissue products (see chart) and does not mean medical devices or human tissue products overall changed in cost. The change in benefits paid may reflect a change in the type of medical devices or human tissue products utilised, or a change in the overall utilisation of medical devices or human tissue products. The medical devices or human tissue products group for which the greatest amount of benefits were paid was cardiac, comprising 18.3% of all medical devices or human tissue products benefits and totalling $123.82 million.
Medical benefits by Speciality group
Benefits paid for medical devices or human tissue products
Service utilisation
Episodes/Services by type
| Episode/Service | December 2025 | Change from September 2025 |
|---|---|---|
| Hospital Episodes | 1,365,591 | 2.2% |
| Hospital Days | 3,311,678 | 1.1% |
| Medical Services | 11,002,976 | -3.3% |
| Medical devices or human tissue Item | 1,016,058 | 4.2% |
| Specialist Orthopaedic | 187,125 | -1.8% |
| Ophthalmic | 116,323 | 4.6% |
| Spinal | 60,144 | 10.1% |
| General Treatment | 28,351,227 | 5.5% |
| Dental | 14,553,364 | 4.0% |
| Chiropractic | 2,014,261 | -10.3% |
| Physiotherapy | 2,830,559 | -9.5% |
| Optical | 3,910,744 | 52.7% |
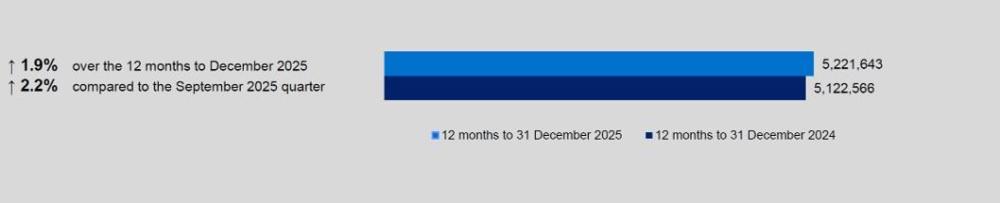
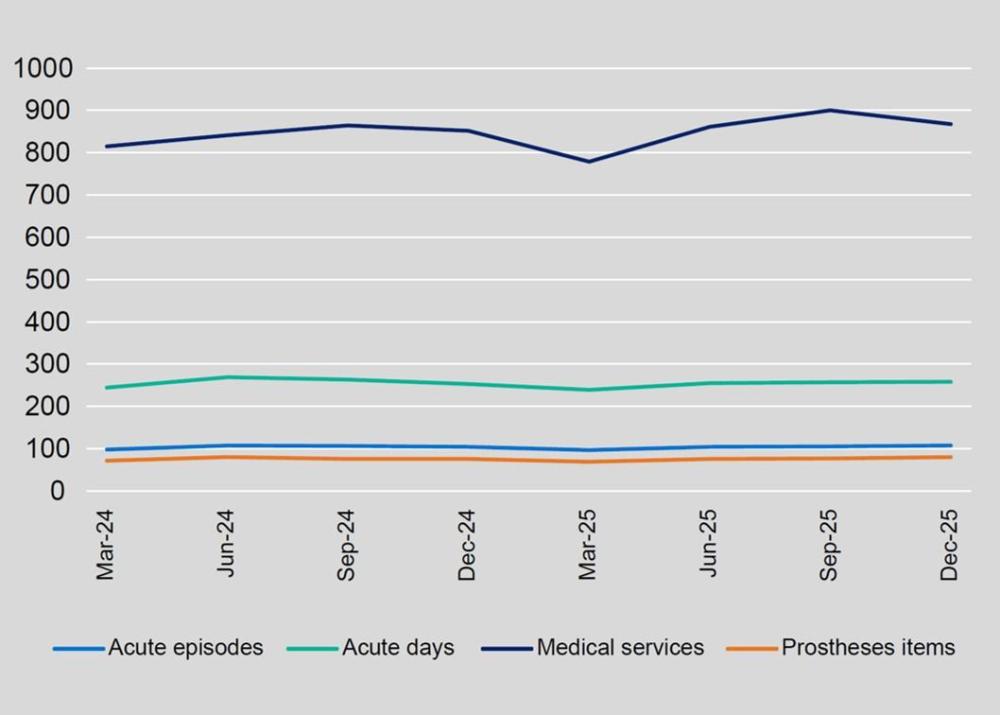
During the December 2025 quarter, insurers paid benefits for 3.3 million days in hospital, arising from 1.4 million hospital episodes of care.
Hospital utilisation is distributed over four categories of hospital - public, private, day only facilities and hospital-substitute. During the December 2025 quarter, hospital episodes were distributed as follows:
- public hospitals 185,846 episodes
- private hospitals 920,271 episodes
- day hospital facilities 74,382 episodes
For the December 2025 quarter, hospital utilisation (measured in episodes) increased by 2.2 % which was mainly driven by hospitals-substitute.
| - | Quarter change | Year change |
|---|---|---|
| Public hospitals | +4.4% | -0.7% |
| Private hospitals | +2.0% | +1.8% |
| Day hospital facilities | +1.5% | +2.8% |
| Hospital-substitute | +0.7% | +8.6% |
Day-only episodes in the four categories of hospital totalled 964,313 with a 2.2% change compared to September 2025.
Hospital treatment services per 1,000 insured persons
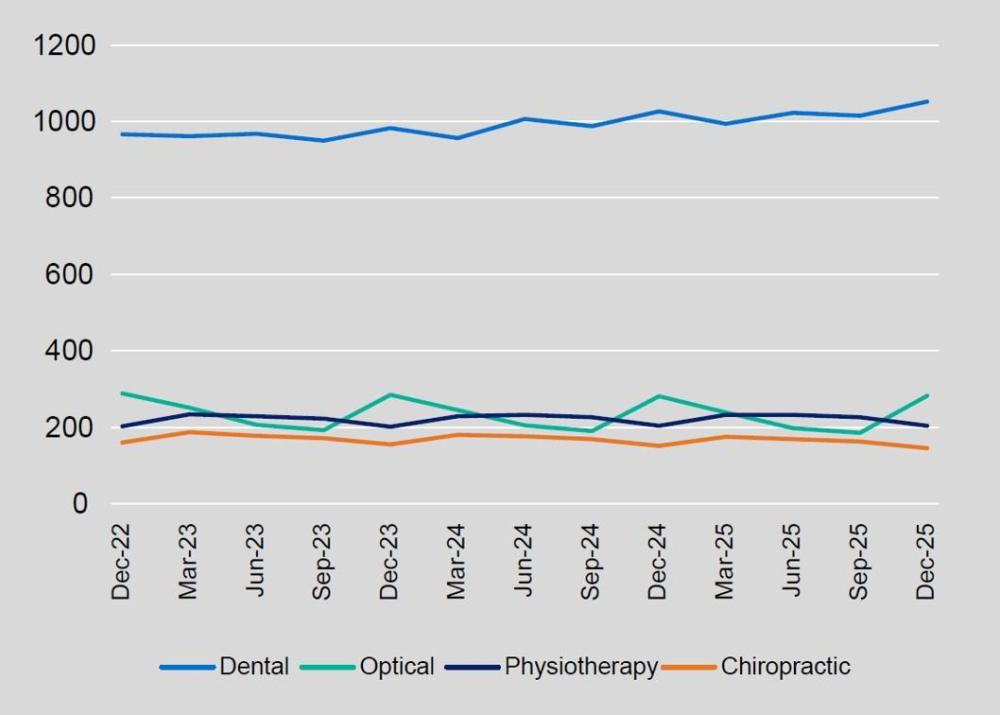
General treatment services (ancillary) per 1,000 insured persons
Out-of-pocket payments
Average out-of-pocket per episode/service
| - | December 2025 | Change from September 25 | Change from December 24 |
|---|---|---|---|
| Hospital treatment | $471.29 | -1.6% | 7.7% |
| Hospital-substitute treatment | $3.60 | -3.6% | -3.8% |
| General treatment ancillary | $62.87 | -1.0% | 5.6% |
| Medical gap where gap was paid | $277.36 | 2.3% | 0.3% |
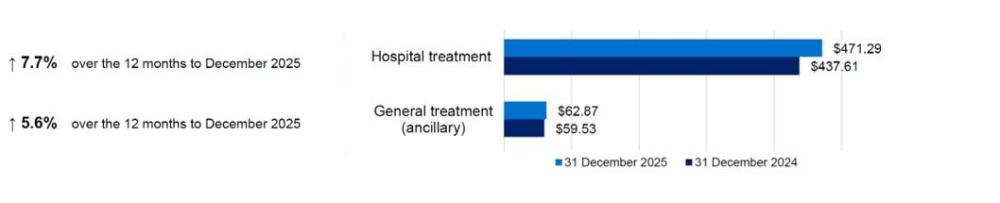
The average out-of-pocket (gap) payment for a hospital episode was $471.29 in the December 2025 quarter. This included out-of-pocket payments for medical services, in addition to any excess or co-payment amounts relating to hospital accommodation.
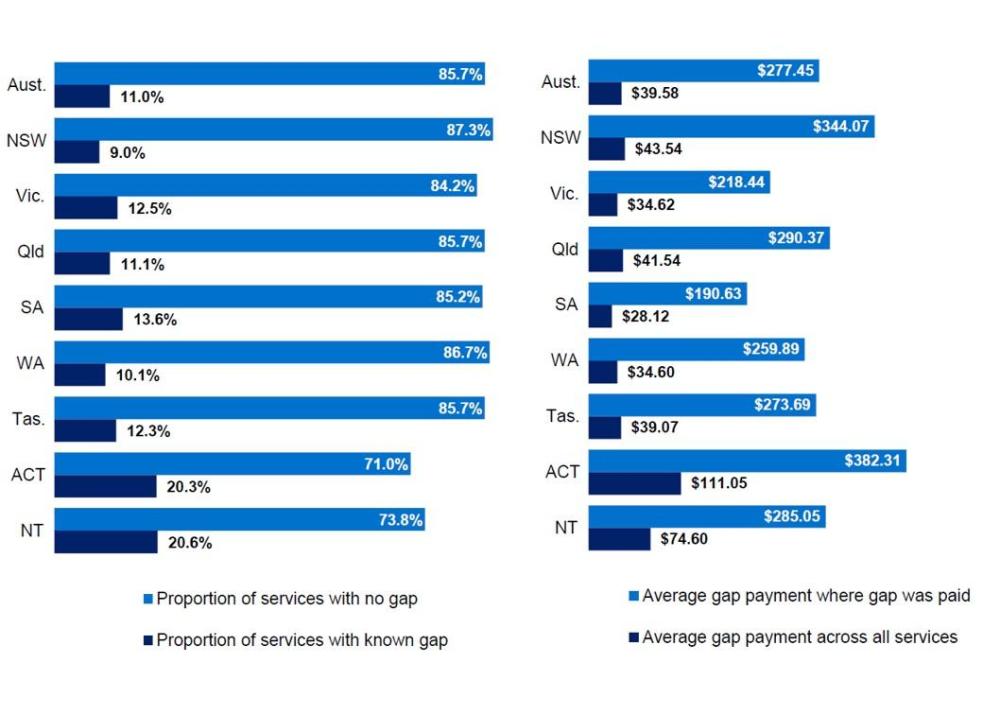
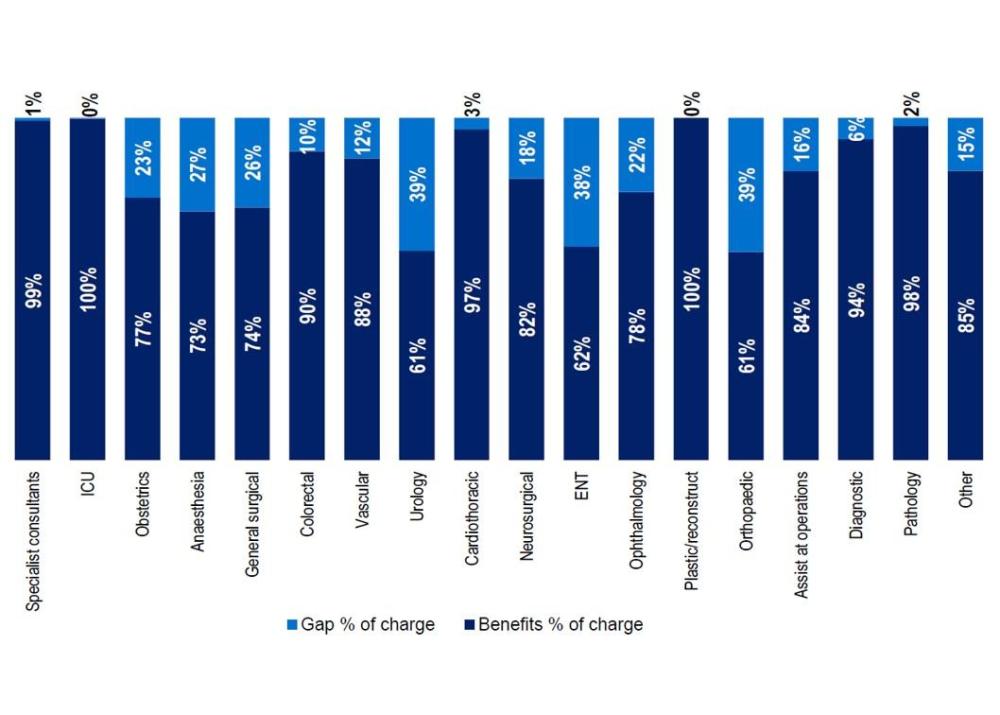
The out-of-pocket payments for hospital episodes increased by 7.7% compared to the same quarter for the previous year. Out-of-pocket payments for medical services were $277.36 where an out-of-pocket payment was payable. The amount of gap for medical services varies depending on the specialty group. The specialty group with the largest out-of-pocket payment was Orthopaedic with an average gap of $847.36. Gap incurred for the various medical services is displayed in the first chart. Medical gap also varies by state and territory, and these differences are shown in the bottom chart.
Medical benefits and out-of-pocket by specialty group
Proportion of services and average out-of-pocket payments