
Statistical publication

Quarterly authorised deposit-taking institution property exposure statistics - March 2026 highlights

Key statistics

Excludes ADIs that are not banks, building societies or credit unions. See ‘Explanatory Notes’ of the Quarterly authorised deposit-taking institution property exposures statistics (excel file) for details of share calculations.

Key residential mortgage lending statistics for ADIs for the quarter were:

ADIs' residential property exposuresMarch 2025March 2026Year-on-year change
Total credit outstanding ($bn)2,349.72,512.76.9%
Owner-occupied loans – share67.6%67.0%-0.69 points
Investment loans – share30.4%31.0%0.61 points
Loans with LVR ≥ 80% – share17.0%16.7%-0.34 points
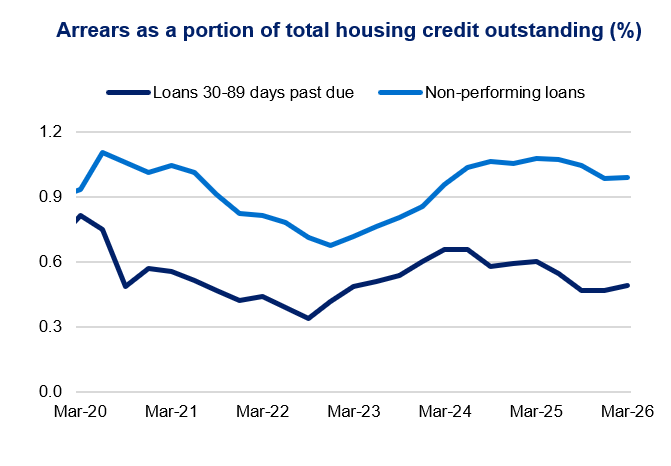
Loans 30–89 days past due – share0.60%0.49%-0.11 points
Non-performing loans1.08%0.99%-0.09 points

Key commercial property statistics for ADIs for the quarter were:

ADIs’ new loans funded during the quarterMarch 2025March 2026Year-on-year change
New loans funded ($bn)154.7182.117.7%
New owner-occupied loans funded – share64.3%62.4%-1.9 points
New investment loans funded – share33.5%35.0%1.51 points
New loans with LVR ≥ 80% – share30.3%30.7%0.38 points
New loans with DTI ≥ 6x – share5.3%6.4%1.12 points
New owner-occupied loans with DTI ≥ 6x – share3.7%3.9%0.19 points
New investment loans with DTI ≥ 6x – share8.2%10.8%2.56 points
ADIs’ commercial property exposuresMarch 2025March 2026Year-on-year change
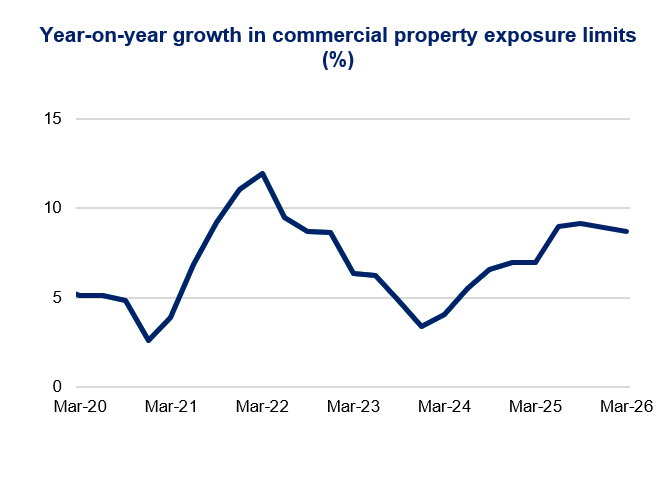
Commercial property exposure limits ($bn)483.7525.88.7%
Commercial property exposures ($bn)448.4487.68.7%

Residential mortgages: new lending
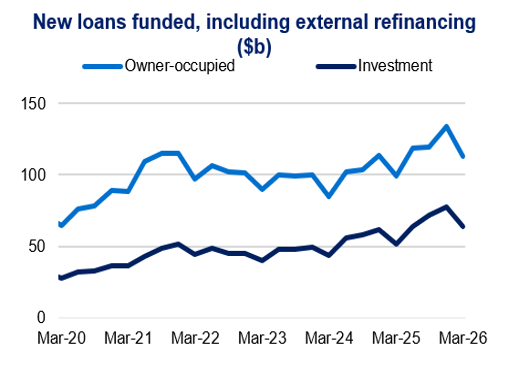
Line chart titled “New loans funded, including external refinancing ($b)” showing owner-occupied loans rising from about $60b to $120–130b, while investment loans increase from about $25b to $70–80b by Mar-26.
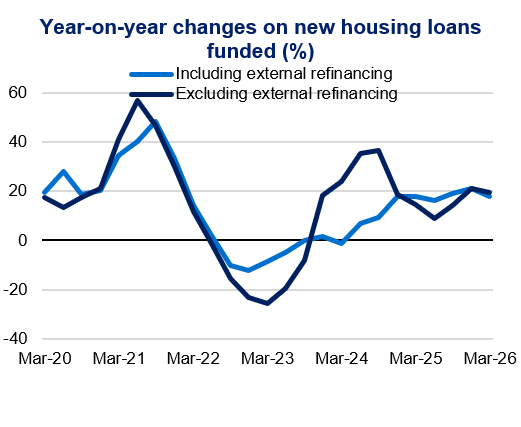
Line chart titled “Year-on-year changes on new housing loans funded (%)” showing both series peaking around 50–55% in Mar-21, falling below -20% in Mar-23, then recovering to about 18–20% by Mar-26.
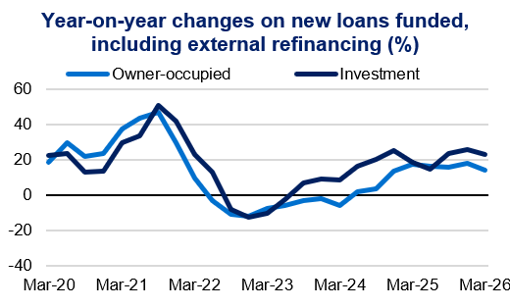
Line chart titled “Year-on-year changes on new loans funded, including external refinancing (%)” showing owner-occupied and investment loans peaking near 45–50% in Mar-21, turning negative in Mar-23, then rising to around 15–25% by Mar-26.
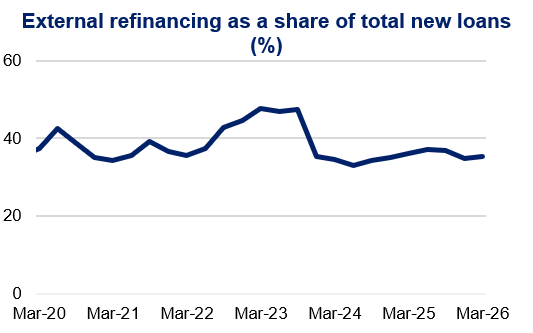
Line chart titled “External refinancing as a share of total new loans (%)” showing refinancing fluctuating around 35–45%, peaking near 48% in Mar-23, then stabilising around 35% by Mar-26.
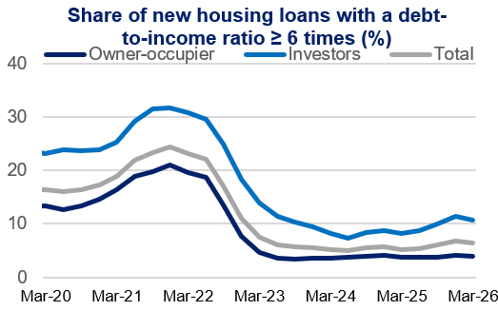
Line chart titled “Share of new housing loans with a debt-to-income ratio ≥ 6 times (%)” showing all series peaking near 25–32% in Mar-21, falling sharply to below 10% in Mar-23, then stabilising with slight increases to Mar-26.
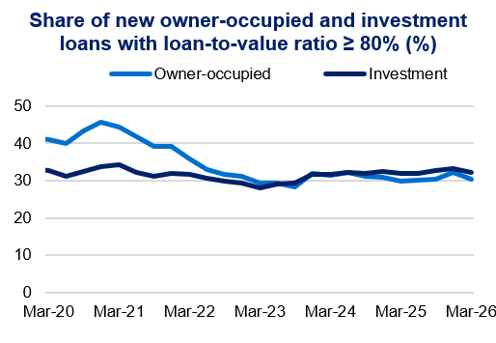
Line chart titled “Share of new owner-occupied and investment loans with loan-to-value ratio ≥ 80% (%)” showing both declining from around 40–45% to about 30% by Mar-23, then stabilising near 30–33% to Mar-26.
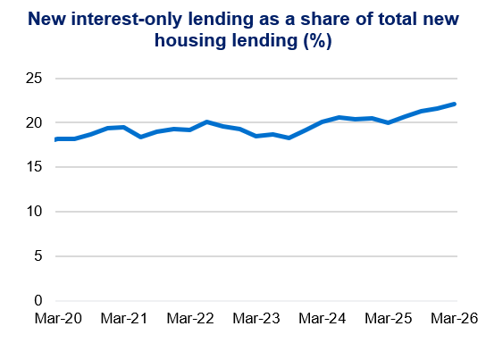
Line chart titled “New interest-only lending as a share of total new housing lending (%)” showing a gradual rise from about 18% in Mar-20 to around 22% by Mar-26, with minor fluctuations.
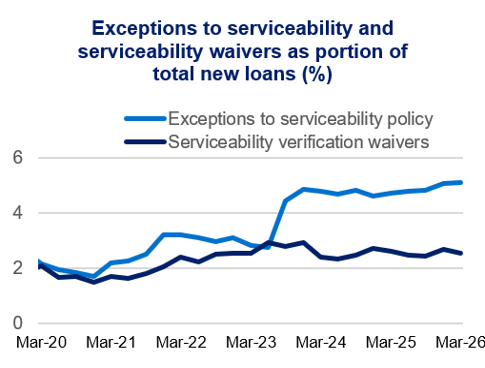
Line chart titled “Exceptions to serviceability and serviceability waivers as portion of total new loans (%)” showing exceptions rising from about 2% to around 5%, while waivers fluctuate between roughly 1.5–3% to Mar-26.

Residential mortgages: outstanding credit
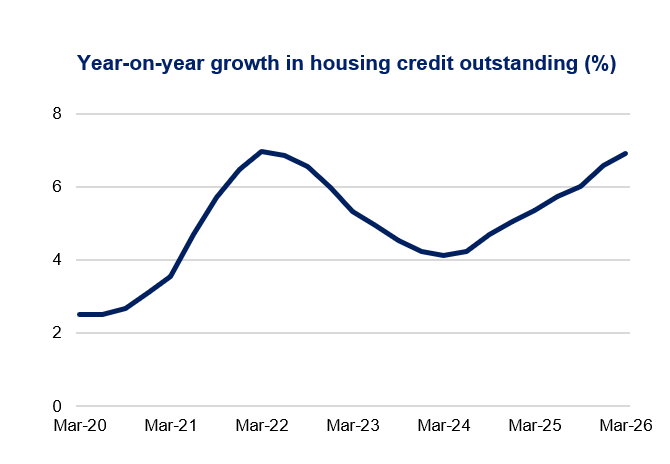
Line chart titled “Year-on-year growth in housing credit outstanding (%)” showing growth rising from about 2.5% in Mar-20 to near 7% in Mar-22, dipping to around 4% in Mar-24, then increasing to about 6.5–7% by Mar-26.
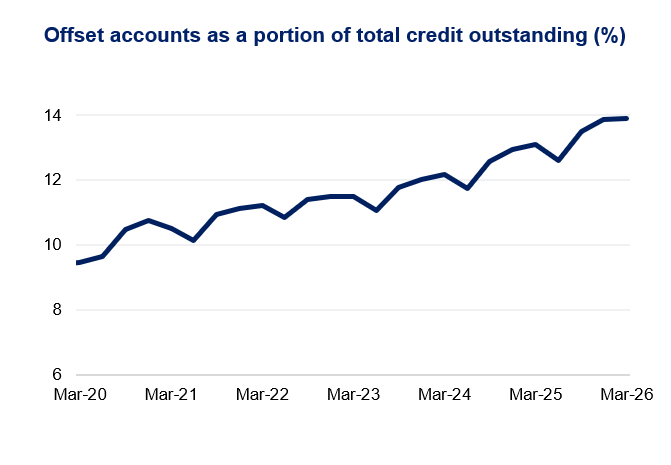
Line chart titled “Offset accounts as a portion of total credit outstanding (%)” showing a steady increase from about 9.5% in Mar-20 to around 14% by Mar-26, with minor fluctuations.
Line chart titled “Arrears as a portion of total housing credit outstanding (%)” showing non-performing loans rising from about 0.9% to around 1.0–1.1%, while 30–89 day arrears fluctuate between roughly 0.4–0.7% to Mar-26.
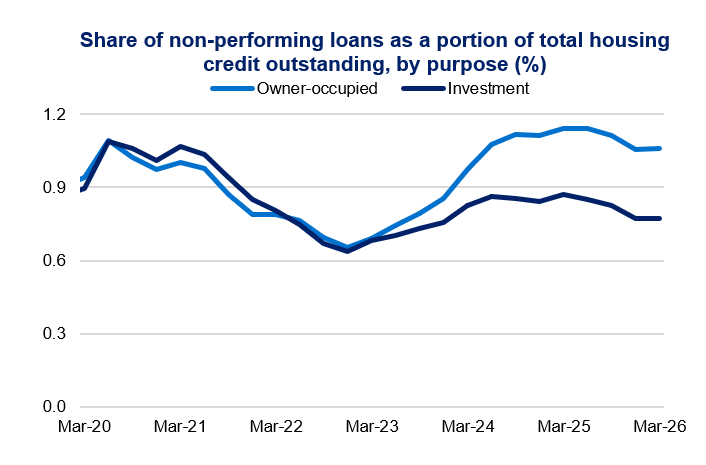
Line chart titled “Share of non-performing loans as a portion of total housing credit outstanding, by purpose (%)” showing both series falling to about 0.6% in Mar-23, then rising, with owner-occupied near 1.1% and investment near 0.8% by Mar-26.
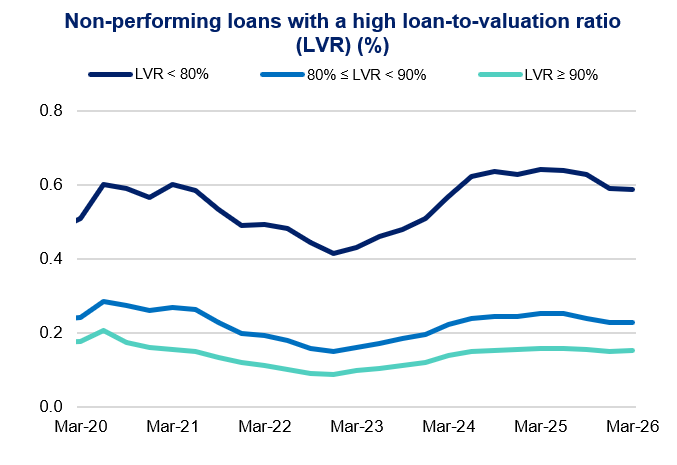
Line chart titled “Non-performing loans with a high loan-to-valuation ratio (LVR) (%)” showing LVR <80% dominant around 0.5–0.65%, with higher LVR bands lower and broadly stable to Mar-26.

Commercial real estate

Line chart titled “Year-on-year growth in commercial property exposure limits (%)” showing growth peaking near 12% in Mar-22, declining to about 3–4% in Mar-24, then recovering to around 9% by Mar-26.
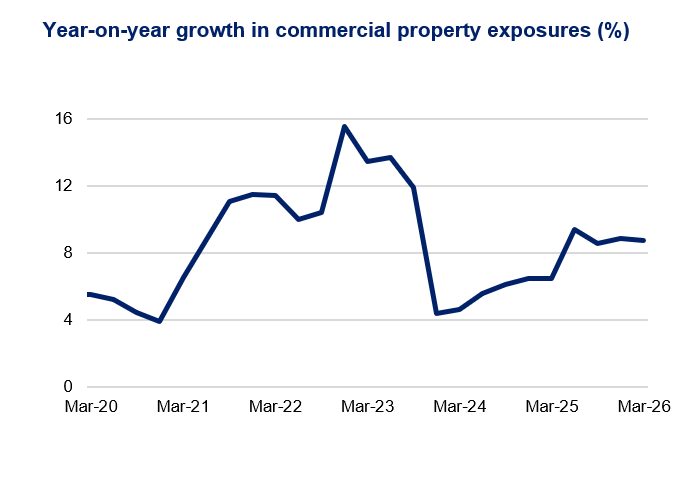
Line chart titled “Year-on-year growth in commercial property exposures (%)” showing growth rising to about 15–16% in Mar-23, falling sharply to around 4% in Mar-24, then recovering to about 8–9% by Mar-26.
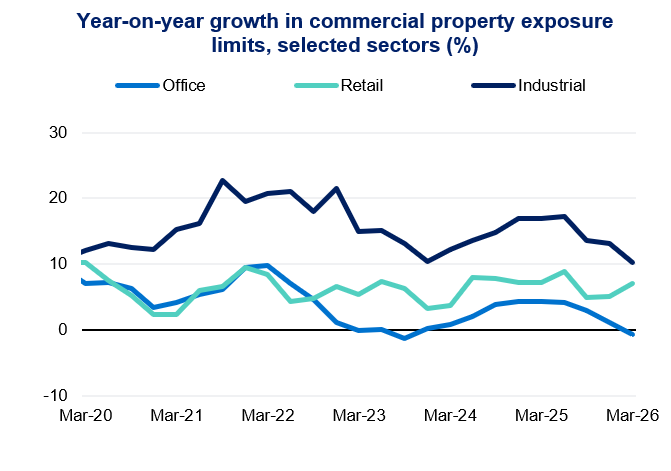
Line chart titled “Year-on-year growth in commercial property exposure limits, selected sectors (%)” showing industrial consistently highest around 10–20%, retail steady near 5–8%, and office falling to near 0% by Mar-26.
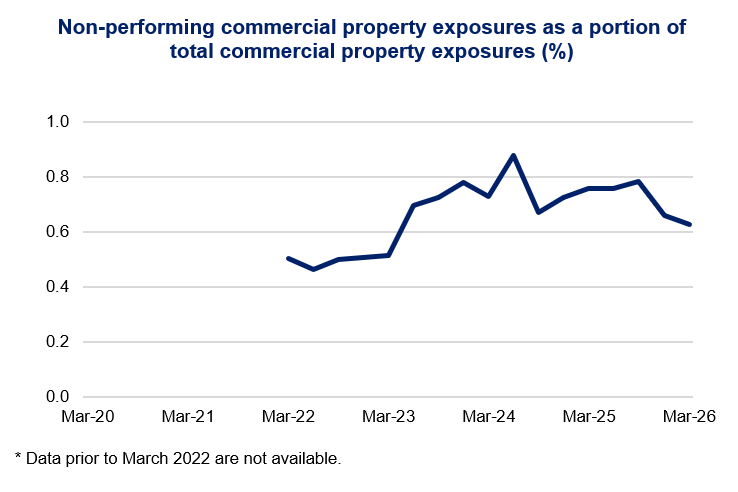
Line chart titled “Non-performing commercial property exposures as a portion of total commercial property exposures (%)” showing NPLs rising from about 0.5% in Mar-22 to near 0.9% in Mar-24, then easing to around 0.6–0.7% by Mar-26.

For more information

Email dataanalytics@apra.gov.au or mail to

Manager, External Data Reporting
Australian Prudential Regulation Authority
GPO Box 9836, Sydney NSW 2001

Looking for discontinued publications?

Search historical snapshots of APRA's website on the Australian Government web archive.

Footnotes