Key statistics
Excludes ADIs that are not banks, building societies or credit unions, such as payment providers. The year-on-year change are calculated using the underlying unrounded values.
| March 2025 | March 2026 | Year-on-year change | |
|---|---|---|---|
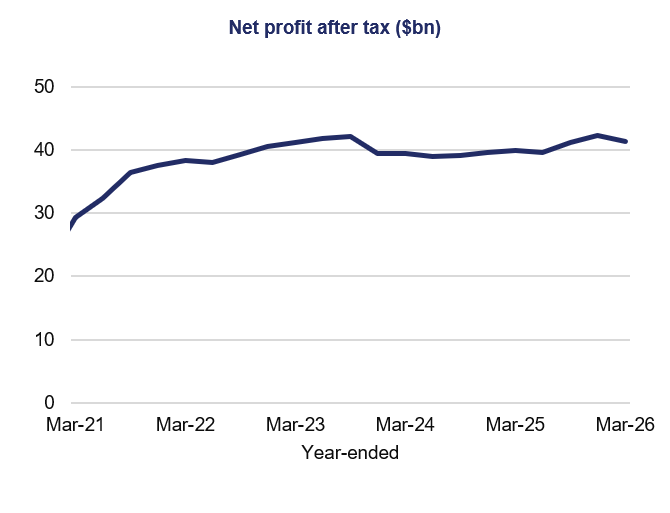
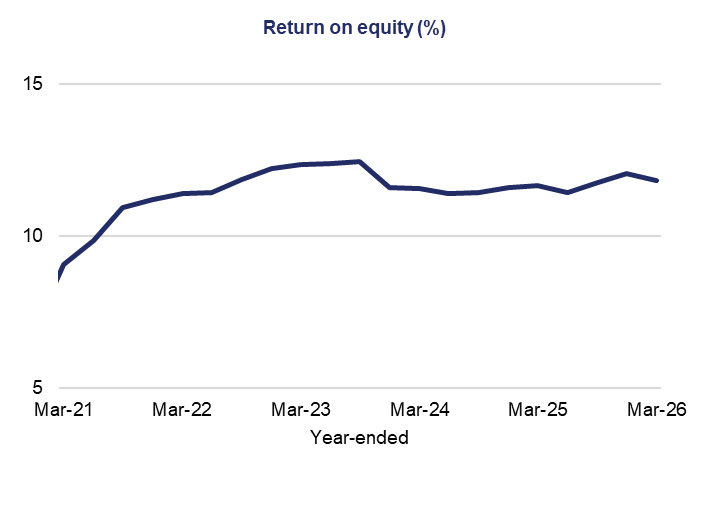
| Net profit after tax (year-end) ($bn) | 40.0 | 41.4 | 3.6% |
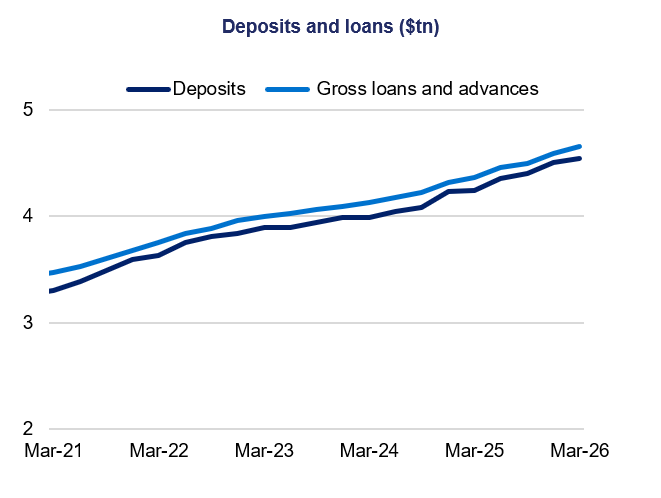
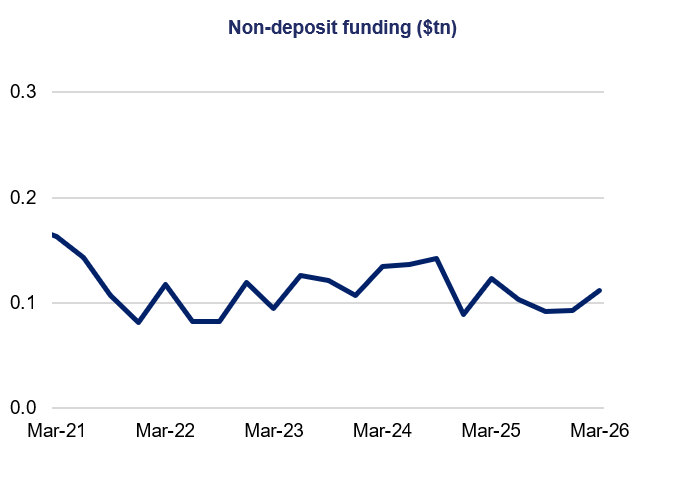
| Total assets ($bn) | 6,545.7 | 6,919.0 | 5.7% |
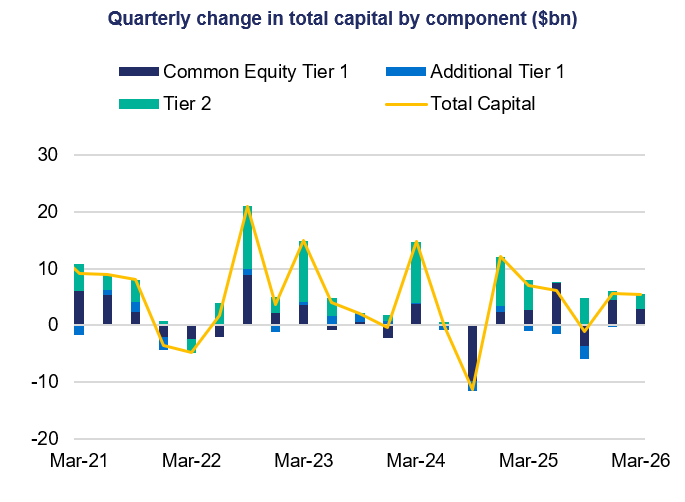
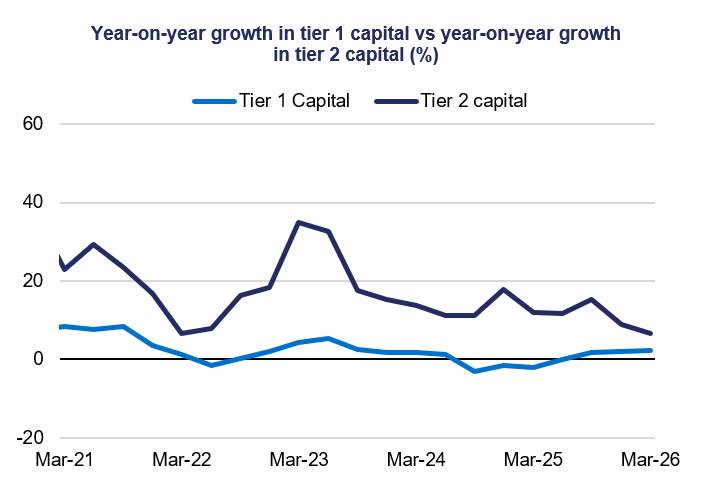
| Total capital base ($bn) | 456.7 | 473.0 | 3.6% |
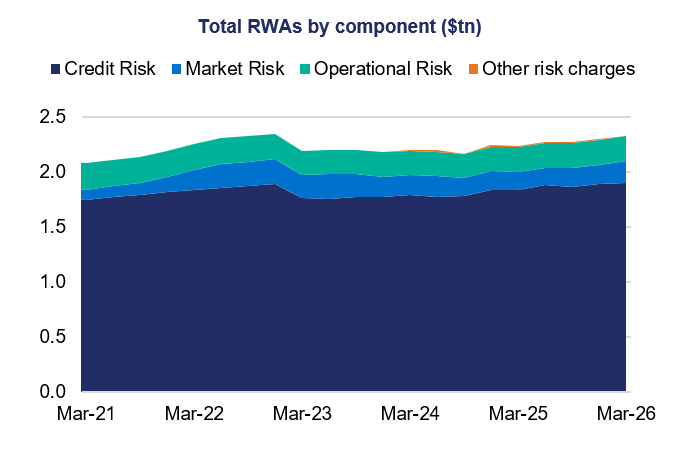
| Total risk-weighted assets ($bn) | 2,236.2 | 2,327.4 | 4.1% |
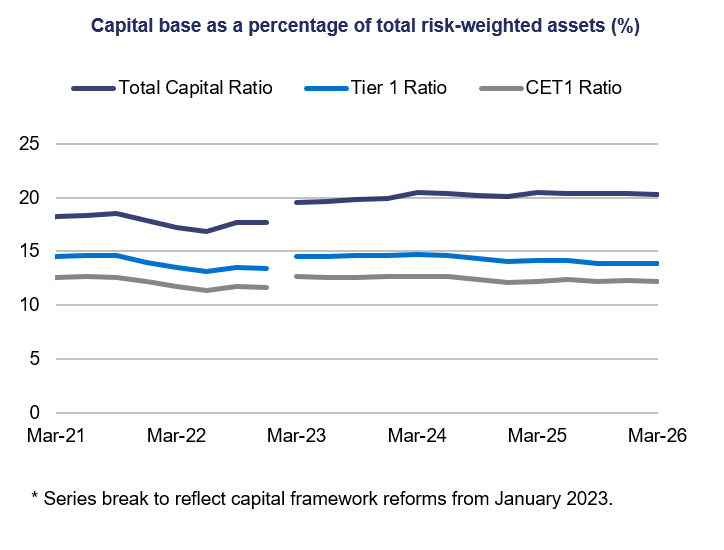
| Total capital ratio | 20.4% | 20.3% | -0.1 points |
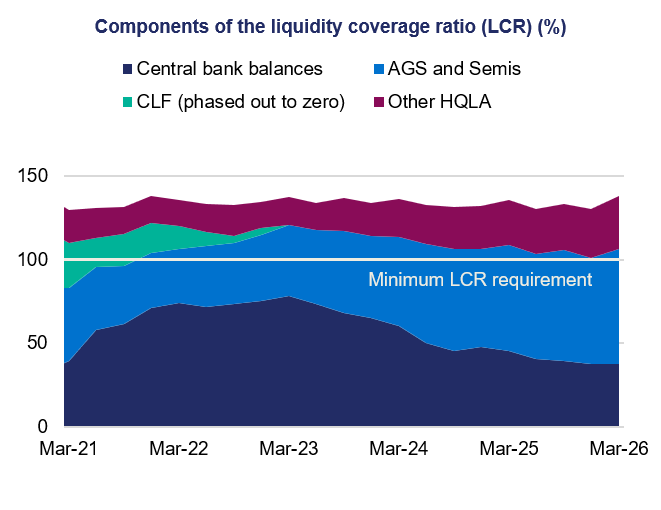
| Liquidity coverage ratio | 136.0% | 137.8% | 1.82 points |
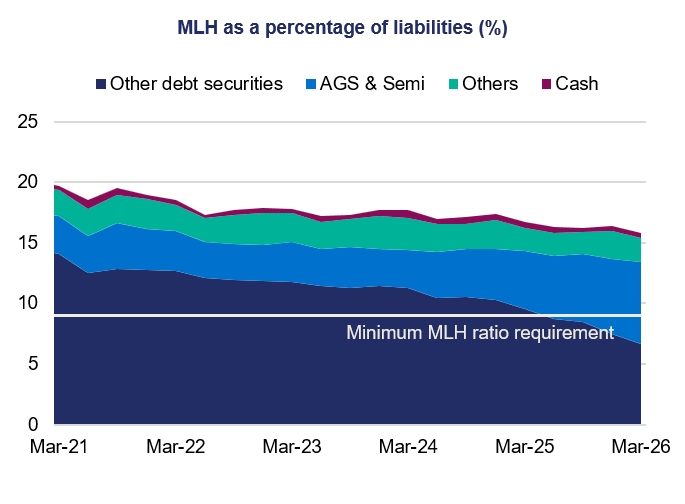
| Minimum liquidity holdings ratio | 16.7% | 15.8% | -0.91 points |
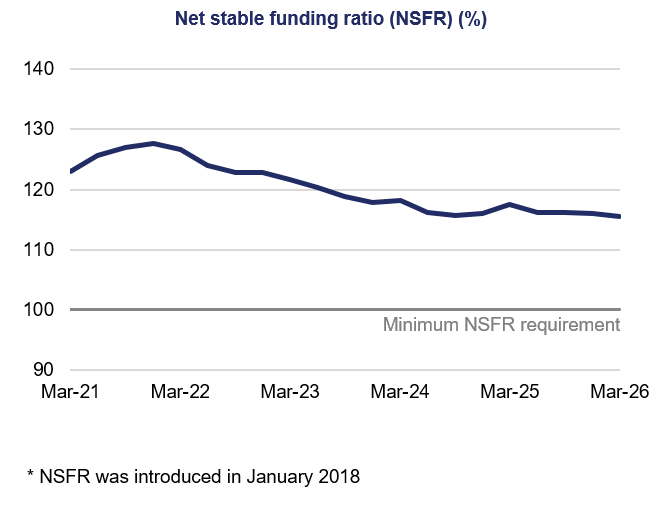
| Net stable funding ratio | 117.5% | 115.5% | -2.01 points |
Financial performance
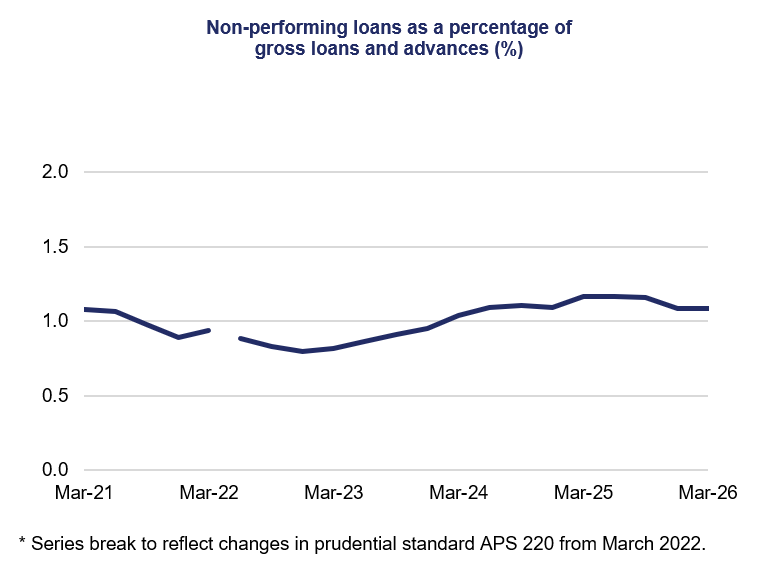
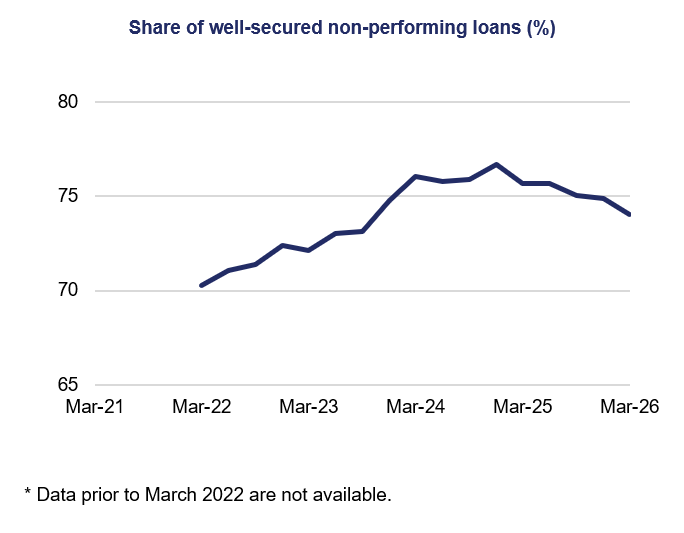
Asset quality
Capital adequacy
Liquidity
Financial position