The valuation of insurance liabilities is an important aspect of the general insurance regulatory framework. The provisions determined as a result of these valuations have a direct impact on the financial soundness of the insurer, and the insurer’s ability to protect the interests of policy holders who have put their trust in it. It is therefore important that insurance liabilities, including risk margins and diversification benefits, are valued in an appropriate manner.
The risk margin allows for the risk that outcomes will differ from the central estimate of the insurance liabilities, both because of the inherent uncertainty of the distribution of possible outcomes, and because of the randomness of future outcomes. It will usually include an allowance for the variability of claims experience within a class of business (stand-alone risk margin) and also a deduction for any diversification between classes of business (diversification benefit). Together the central estimate and the risk margin are intended to produce a provision for insurance liabilities that will prove to be sufficient to pay claims as they fall due 75 per cent of the time. This 75 per cent probability of sufficiency level is the sufficiency level required by APRA.
This report provides a detailed summary of the risk margins adopted by insurers for varying classes of business. The role of the report is not to prescribe particular risk margins, but rather to give some insight into the range of risk margins currently adopted by industry. APRA uses the information provided here for benchmarking and for checking on the risk margins adopted by individual insurers. Actuaries may similarly find this information useful.
Charts
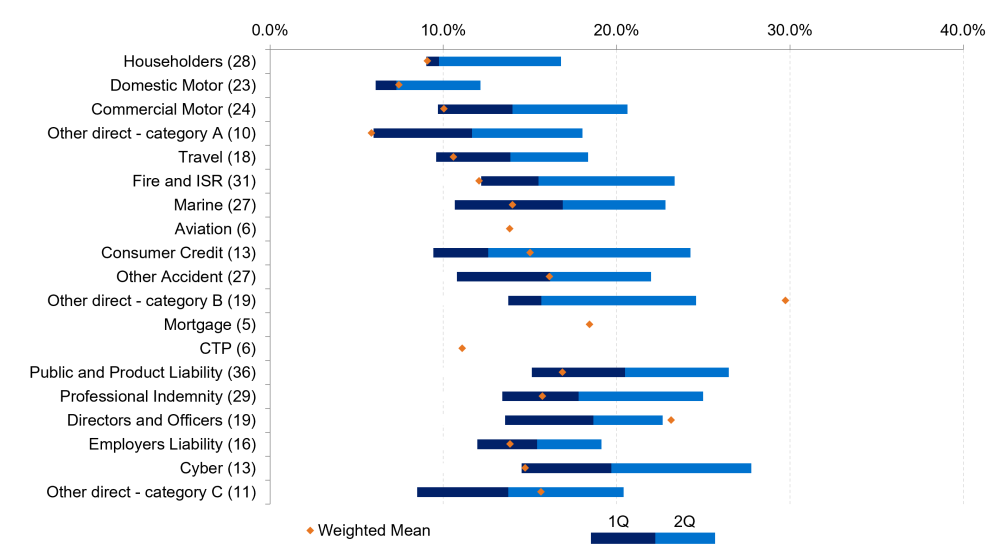
1. OCL Risk Margins for Direct Business
This chart shows the quartiles as well as the weighted mean of the outstanding claim liabilities stand-alone risk margin by direct business class.
For some classes, there are too few insurers to allow the weighted average and/or quartile range to be shown.
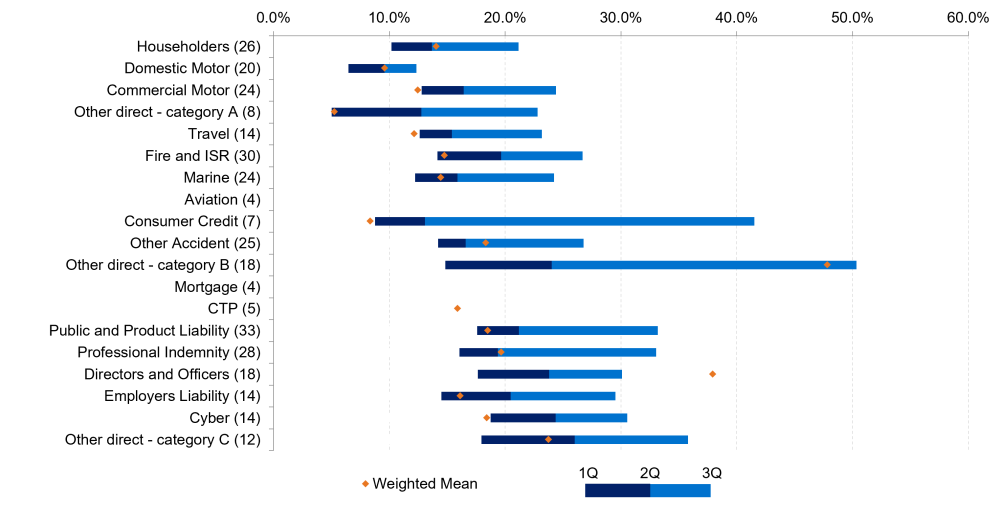
2. PL Risk Margins for Direct Business
This chart shows the quartiles as well as the weighted mean of the premium liabilities stand-alone risk margin by direct business class.
For some classes, there are too few insurers to allow the weighted average and/or quartile range to be shown.
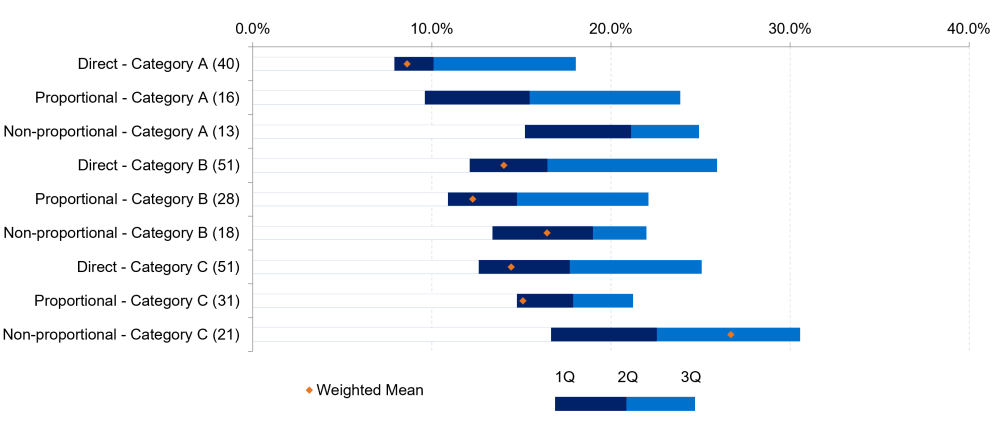
3. OCL Risk Margins for Reinsurance Business (with Direct Business Comparison)
This chart shows quartiles as well as the weighted mean of the outstanding claim liabilities stand-alone risk margin by reinsurance business class. Direct business classes are included for comparison. The weighted mean for both ‘category A’ reinsurance risk margins is not shown because each is distorted by results from large captive reinsurers that are atypical of reinsurers generally.
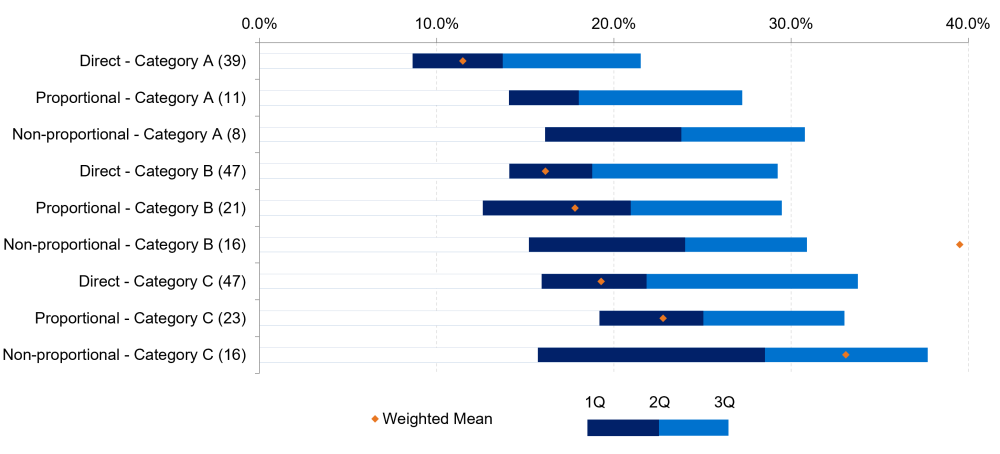
4. PL Risk Margins for Reinsurance Business (with Direct Business Comparison)
This chart shows the quartiles as well as the weighted mean of the premium liabilities stand-alone risk margin by reinsurance business class. Direct business classes are included for comparison. The weighted mean for both ‘category A’ reinsurance risk margins is not shown because each is distorted by results from large captive reinsurers that are atypical of reinsurers generally.
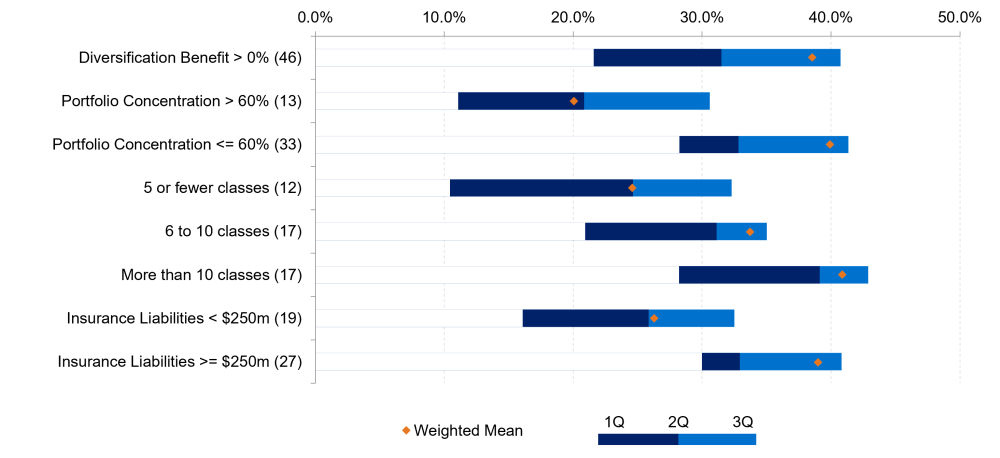
5. Diversification Benefit % by Portfolio Concentration
This chart shows the quartiles as well as the weighted mean of diversification benefit adopted by insurers. Each set of rows represents a different segmentation of the insurers that reported a diversification benefit.
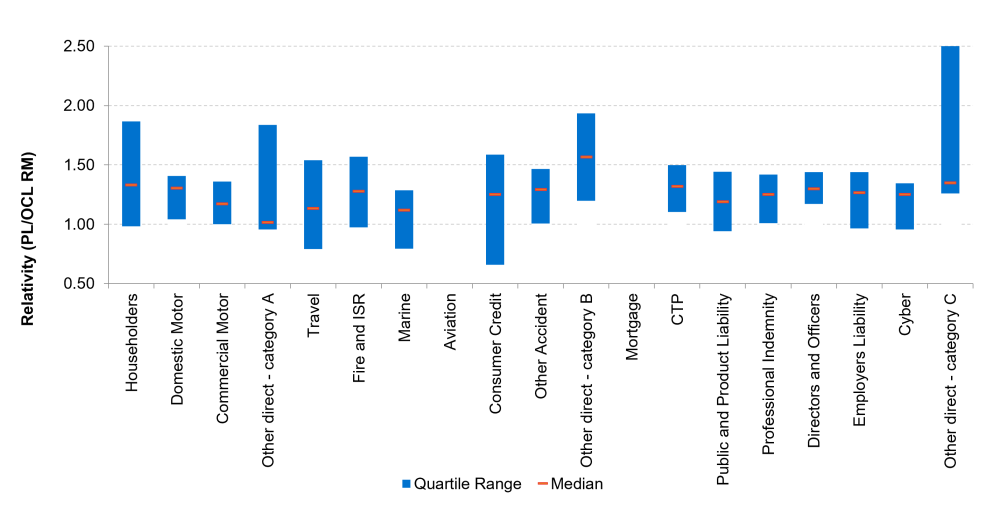
6. PL Scale up Factors by Class of Business
This chart shows the quartile range and median of the ratio of PL to OCL risk margins by class of business.
Group 1 Tables
Outstanding Claim Liabilities for Direct Business
This table shows the number of insurers as well as the weighted mean, weighted standard deviation and quartiles of the outstanding claim liabilities stand-alone risk margin by direct business class.
For some classes, there are too few insurers to allow the weighted average and/or quartile range to be shown.
| Direct Classes | Number of Insurers | Weighted Average RM% | RM% Quartiles | |||
|---|---|---|---|---|---|---|
| - | - | Mean | Std dev | 1st | 2nd | 3rd |
| Householders | 28 | 9.1% | 1.7% | 9.0% | 9.8% | 16.8% |
| Domestic Motor | 23 | 7.4% | 2.0% | 6.1% | 7.3% | 12.1% |
| Commercial Motor | 24 | 10.0% | 2.6% | 9.7% | 14.0% | 20.6% |
| Other direct - category A | 10 | 5.8% | 2.8% | 6.0% | 11.7% | 18.0% |
| Travel | 18 | 10.6% | 3.9% | 9.6% | 13.9% | 18.3% |
| Fire and ISR | 31 | 12.1% | 5.1% | 12.2% | 15.5% | 23.3% |
| Marine | 27 | 14.0% | 6.6% | 10.7% | 16.9% | 22.8% |
| Aviation | 6 | 13.8% | 2.1% | - | - | - |
| Consumer Credit | 13 | 15.0% | 11.6% | 9.4% | 12.6% | 24.3% |
| Other Accident | 27 | 16.1% | 10.9% | 10.8% | 16.2% | 22.0% |
| Other direct - category B | 19 | 29.7% | 9.7% | 13.8% | 15.7% | 24.6% |
| Mortgage | 5 | 18.4% | 2.5% | - | - | - |
| CTP | 6 | 11.1% | 1.3% | - | - | - |
| Public and Product Liability | 36 | 16.9% | 6.9% | 15.1% | 20.5% | 26.5% |
| Professional Indemnity | 29 | 15.7% | 5.6% | 13.4% | 17.8% | 25.0% |
| Directors and Officers | 19 | 23.2% | 15.3% | 13.6% | 18.7% | 22.7% |
| Employers Liability | 16 | 13.8% | 2.8% | 12.0% | 15.4% | 19.1% |
| Cyber | 13 | 14.7% | 5.4% | 14.5% | 19.7% | 27.8% |
| Other direct - category C | 11 | 15.6% | 8.0% | 8.5% | 13.8% | 20.4% |
Premium Liabilities for Direct Business
This table shows the number of insurers as well as the weighted mean, weighted standard deviation and quartiles of the premium liabilities stand-alone risk margin by direct business class.
For some classes, there are too few insurers to allow the weighted average and/or quartile range to be shown.
| Direct Classes | Number of Insurers | Weighted Average RM% | RM% Quartiles | |||
|---|---|---|---|---|---|---|
| - | - | Mean | Std dev | 1st | 2nd | 3rd |
| Householders | 26 | 14.0% | 5.2% | 10.2% | 13.7% | 21.2% |
| Domestic Motor | 20 | 9.6% | 2.9% | 6.5% | 9.6% | 12.4% |
| Commercial Motor | 24 | 12.5% | 3.9% | 12.8% | 16.4% | 24.4% |
| Other direct - category A | 8 | 5.3% | 3.0% | 5.0% | 12.8% | 22.8% |
| Travel | 14 | 12.2% | 4.3% | 12.6% | 15.4% | 23.2% |
| Fire and ISR | 30 | 14.7% | 5.6% | 14.2% | 19.7% | 26.7% |
| Marine | 24 | 14.4% | 4.3% | 12.2% | 15.9% | 24.2% |
| Aviation | 4 | - | - | - | - | - |
| Consumer Credit | 7 | 8.3% | 10.3% | 8.8% | 13.1% | 41.5% |
| Other Accident | 25 | 18.3% | 11.8% | 14.2% | 16.6% | 26.8% |
| Other direct - category B | 18 | 47.8% | 45.3% | 14.8% | 24.0% | 50.3% |
| Mortgage | 4 | - | - | - | - | - |
| CTP | 5 | 15.9% | 2.3% | - | - | - |
| Public and Product Liability | 33 | 18.5% | 8.5% | 17.6% | 21.2% | 33.2% |
| Professional Indemnity | 28 | 19.6% | 9.0% | 16.1% | 19.4% | 33.1% |
| Directors and Officers | 18 | 37.9% | 36.2% | 17.7% | 23.8% | 30.1% |
| Employers Liability | 14 | 16.1% | 3.7% | 14.5% | 20.5% | 29.5% |
| Cyber | 14 | 18.4% | 7.4% | 18.8% | 24.4% | 30.5% |
| Other direct - category C | 12 | 23.7% | 21.7% | 18.0% | 26.0% | 35.8% |
Outstanding Claim Liabilities for Reinsurance Business (with Direct Business Comparison)
This table shows the number of insurers as well as the weighted mean, weighted standard deviation and quartiles of the outstanding claim liabilities stand-alone risk margin by reinsurance business class. Direct business classes are included for comparison. The weighted mean for both ‘category A’ reinsurance risk margins is not shown because each is distorted by results from large captive reinsurers that are atypical of reinsurers generally.
| Reinsurance Classes | Number of Insurers | Weighted Average RM% | RM% Quartiles | |||
|---|---|---|---|---|---|---|
| - | - | Mean | Std dev | 1st | 2nd | 3rd |
| Direct - Category A | 40 | 8.6% | 2.0% | 7.9% | 10.1% | 18.0% |
| Proportional - Category A | 16 | - | - | 9.6% | 15.5% | 23.9% |
| Non-proportional - Category A | 13 | - | - | 15.2% | 21.1% | 24.9% |
| Direct - Category B | 51 | 14.0% | 7.2% | 12.1% | 16.4% | 25.9% |
| Proportional - Category B | 28 | 12.3% | 3.8% | 10.9% | 14.8% | 22.1% |
| Non-proportional - Category B | 18 | 16.4% | 5.1% | 13.4% | 19.0% | 22.0% |
| Direct - Category C | 51 | 14.4% | 5.1% | 12.6% | 17.7% | 25.1% |
| Proportional - Category C | 31 | 15.1% | 4.4% | 14.8% | 17.9% | 21.2% |
| Non-proportional - Category C | 21 | 26.7% | 12.3% | 16.7% | 22.6% | 30.6% |
Premium Liabilities for Reinsurance Business (with Direct Business Comparison)
This table shows the number of insurers as well as the weighted mean, weighted standard deviation and quartiles of the premium liabilities stand-alone risk margin by reinsurance business class. Direct business classes are included for comparison. The weighted mean for both ‘category A’ reinsurance risk margins is not shown because each is distorted by results from large captive reinsurers that are atypical of reinsurers generally.
| Reinsurance Classes | Number of Insurers | Weighted Average RM% | RM% Quartiles | |||
|---|---|---|---|---|---|---|
| - | - | Mean | Std dev | 1st | 2nd | 3rd |
| Direct - Category A | 39 | 11.5% | 3.5% | 8.6% | 13.7% | 21.5% |
| Proportional - Category A | 11 | - | - | 14.1% | 18.0% | 27.2% |
| Non-proportional - Category A | 8 | - | - | 16.1% | 23.8% | 30.8% |
| Direct - Category B | 47 | 16.1% | 11.2% | 14.1% | 18.8% | 29.2% |
| Proportional - Category B | 21 | 17.8% | 10.1% | 12.6% | 20.9% | 29.5% |
| Non-proportional - Category B | 16 | 39.5% | 53.2% | 15.2% | 24.0% | 30.9% |
| Direct - Category C | 47 | 19.3% | 8.4% | 15.9% | 21.8% | 33.8% |
| Proportional - Category C | 23 | 22.8% | 6.9% | 19.2% | 25.0% | 33.0% |
| Non-proportional - Category C | 16 | 33.1% | 9.2% | 15.7% | 28.5% | 37.7% |
Diversification Benefit for Direct and Reinsurance business
This table shows the number of insurers as well as the weighted mean, weighted standard deviation and quartiles of diversification benefit adopted by insurers. Each set of rows represents a different segmentation of the insurers that reported a diversification benefit.
| Direct Classes | Number of Insurers | Weighted Average DB% | DB% Quartiles | |||
|---|---|---|---|---|---|---|
| - | - | Mean | Std dev | 1st | 2nd | 3rd |
| Diversification Benefit > 0% | 46 | 38.5% | 10.2% | 21.6% | 31.5% | 40.7% |
| Portfolio Concentration > 60% | 13 | 20.1% | 14.3% | 11.1% | 20.8% | 30.6% |
| Portfolio Concentration <= 60% | 33 | 39.9% | 8.3% | 28.2% | 32.8% | 41.4% |
| 5 or fewer classes | 12 | 24.6% | 15.4% | 10.5% | 24.6% | 32.3% |
| 6 to 10 classes | 17 | 33.7% | 7.3% | 20.9% | 31.1% | 35.0% |
| More than 10 classes | 17 | 40.9% | 9.4% | 28.2% | 39.1% | 42.9% |
| Insurance Liabilities < $250m | 19 | 26.3% | 18.6% | 16.1% | 25.9% | 32.5% |
| Insurance Liabilities >= $250m | 27 | 39.0% | 9.5% | 30.0% | 32.9% | 40.8% |
Group 2 Tables
Outstanding Claim Liabilities for Direct Business by Size of Insurer
This table shows the number of insurers as well as the weighted average of outstanding claim liabilities stand-alone risk margin for the largest 5 insurers and for the remaining insurers by direct business class.
For some classes, there are too few insurers to allow the weighted average to be shown.
| Direct Classes | Number of Insurers | Weighted Average RM% | |
|---|---|---|---|
| - | - | Largest 5 insurers | Remaining Insurers |
| Householders | 28 | 9.4% | 8.3% |
| Domestic Motor | 23 | 7.6% | 6.9% |
| Commercial Motor | 24 | 9.7% | 13.2% |
| Other direct - category A | 10 | 5.5% | 16.9% |
| Travel | 18 | 10.3% | 14.3% |
| Fire and ISR | 31 | 11.4% | 13.4% |
| Marine | 27 | 12.1% | 17.8% |
| Aviation | 6 | - | - |
| Consumer Credit | 13 | 14.9% | 16.0% |
| Other Accident | 27 | 16.7% | 14.7% |
| Other direct - category B | 19 | 30.4% | 14.5% |
| Mortgage | 5 | - | - |
| CTP | 6 | - | - |
| Public and Product Liability | 36 | 13.4% | 23.3% |
| Professional Indemnity | 29 | 17.6% | 14.1% |
| Directors and Officers | 19 | 25.4% | 17.7% |
| Employers Liability | 16 | 13.7% | 14.7% |
| Cyber | 13 | 14.7% | 16.0% |
| Other direct - category C | 11 | 15.9% | 12.0% |
Premium Liabilities for Direct Business by Size of Insurer
This table shows the number of insurers as well as the weighted average of premium liabilities stand-alone risk margin for the largest 5 insurers and for the remaining insurers by direct business class.
For some classes, there are too few insurers to allow the weighted average to be shown.
| Direct Classes | Number of Insurers | Weighted Average RM% | |
|---|---|---|---|
| - | - | Largest 5 insurers | Remaining Insurers |
| Householders | 26 | 15.2% | 11.4% |
| Domestic Motor | 20 | 9.9% | 8.8% |
| Commercial Motor | 24 | 12.1% | 15.9% |
| Other direct - category A | 8 | - | - |
| Travel | 14 | 11.7% | 18.8% |
| Fire and ISR | 30 | 14.2% | 15.8% |
| Marine | 24 | 14.0% | 15.4% |
| Aviation | 4 | - | - |
| Consumer Credit | 7 | - | - |
| Other Accident | 25 | 19.5% | 16.5% |
| Other direct - category B | 18 | 46.6% | 51.7% |
| Mortgage | 4 | - | - |
| CTP | 5 | - | - |
| Public and Product Liability | 33 | 15.9% | 22.7% |
| Professional Indemnity | 28 | 18.2% | 20.8% |
| Directors and Officers | 18 | 43.4% | 24.0% |
| Employers Liability | 14 | 16.0% | 17.6% |
| Cyber | 14 | 18.2% | 27.3% |
| Other direct - category C | 12 | 21.7% | 44.1% |
PL Scale Up Factors for Direct Business
This table shows the quartiles of the ratio of PL to OCL risk margins by direct business class.
For some classes, there are too few insurers to allow the quartiles to be shown.
| Direct Classes | PL Scale Up Factor Quartiles | ||
|---|---|---|---|
| - | 1st | 2nd | 3rd |
| Householders | 0.98 | 1.33 | 1.87 |
| Domestic Motor | 1.04 | 1.31 | 1.41 |
| Commercial Motor | 1.00 | 1.17 | 1.36 |
| Other direct - category A | 0.96 | 1.01 | 1.84 |
| Travel | 0.79 | 1.13 | 1.54 |
| Fire and ISR | 0.98 | 1.28 | 1.57 |
| Marine | 0.79 | 1.12 | 1.29 |
| Aviation | - | - | - |
| Consumer Credit | 0.66 | 1.25 | 1.59 |
| Other Accident | 1.01 | 1.29 | 1.47 |
| Other direct - category B | 1.20 | 1.57 | 1.93 |
| Mortgage | - | - | - |
| CTP | 1.10 | 1.32 | 1.50 |
| Public and Product Liability | 0.94 | 1.19 | 1.44 |
| Professional Indemnity | 1.01 | 1.25 | 1.42 |
| Directors and Officers | 1.17 | 1.30 | 1.44 |
| Employers Liability | 0.96 | 1.27 | 1.44 |
| Cyber | 0.96 | 1.25 | 1.35 |
| Other direct - category C | 1.26 | 1.35 | 2.56 |
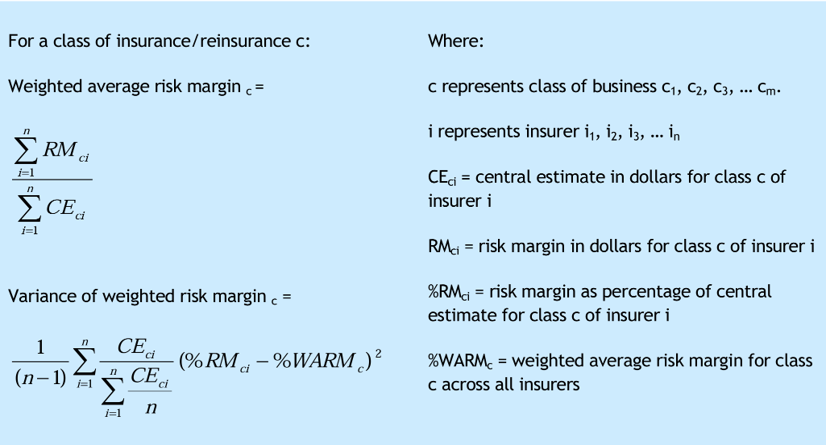
Statistical methodology
The following image depicts the statistical methodology used in this report.