
Statistical publication

Quarterly authorised deposit-taking institution property exposure statistics - June 2026 highlights

Published
17 September 2026

Key statistics

Excludes ADIs that are not banks, building societies or credit unions. See ‘Explanatory Notes’ of the Quarterly authorised deposit-taking institution property exposures statistics (excel file) for details of share calculations.

Key residential mortgage lending statistics for ADIs for the quarter were:

ADIs' residential property exposuresJune 2025June 2026Year-on-year change
Total credit outstanding ($bn)2,391.82,558.57.0%
Owner-occupied loans - share67.5%66.7%-0.8 points
Investment loans - share30.5%31.2%0.72 points
Loans with loan-to-valuation ratio (LVR) ≥ 80 per cent - share17.6%16.7%-0.9 points
Loans 30-89 days past due - share0.66%0.54%-0.12 points
Non-performing loans1.04%1.01%-0.03 points
ADIs’ new loans funded during the quarterJune 2025June 2026Year-on-year change
New loans funded ($bn)187.6200.56.8%
New owner-occupied loans funded - share63.6%61.9%-1.72 points
New investment loans funded - share34.1%35.6%1.48 points
New loans with LVR ≥ 80 per cent funded - share30.4%29.7%-0.72 points
New loans with debt-to-income (DTI) ratio ≥ 6x funded - share5.5%5.6%0.1 points
New owner-occupied loans with debt-to-income (DTI) ratio ≥ 6x funded - share3.7%3.7%-0.04 points
New investment loans with debt-to-income (DTI) ratio ≥ 6x funded - share8.7%8.9%0.13 points

Key commercial property statistics for ADIs for the quarter were:

ADIs’ commercial property exposuresJune 2025June 2026Year-on-year change
Commercial property exposure limits ($bn)498.2541.08.6%
Commercial property exposures ($bn)463.3501.68.3%

Residential mortgages: new lending
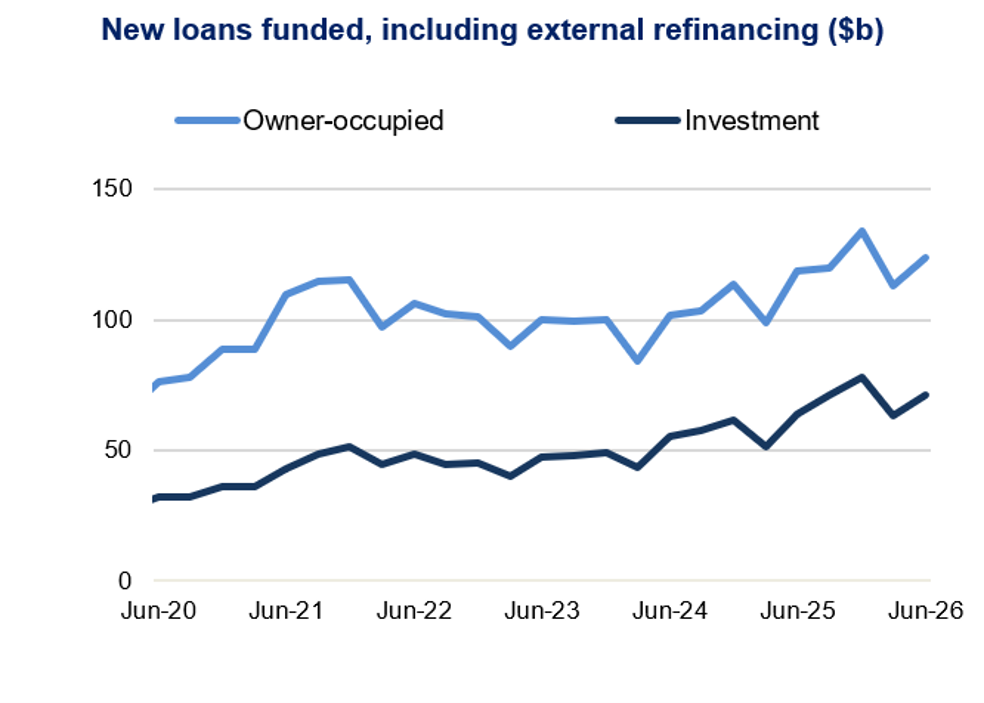
Line chart titled “New loans funded, including external refinancing ($b)” compares owner-occupied lending in light blue with investment lending in navy from Jun-20 to Jun-26. Owner-occupied loans rise from about $75 billion to $125 billion, peaking near $130 billion in late 2025, while investment loans increase from roughly $30 billion to $70 billion after peaking near $80 billion; gridlines mark 0, 50, 100, and 150.
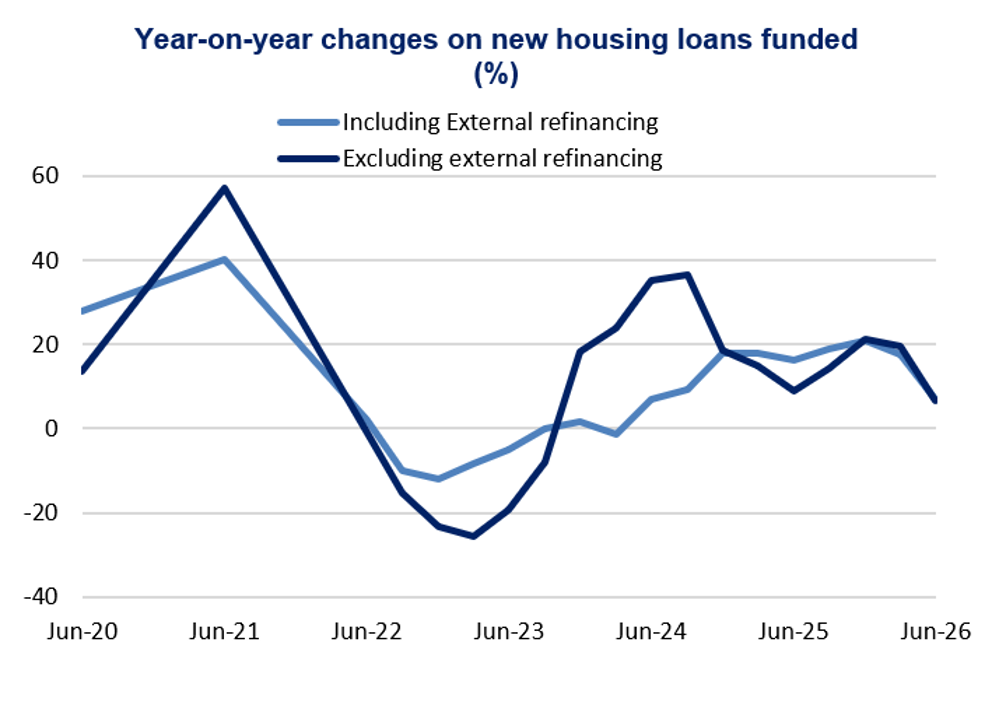
Line chart titled “Year-on-year changes on new housing loans funded (%)” compares including external refinancing (light blue) and excluding external refinancing (navy) from Jun-20 to Jun-26. Including series peaks near 40% in Jun-21, falls below zero during Jun-22–Jun-23, then recovers; excluding series reaches about 57% in Jun-21, bottoms near −26% in Jun-23, rebounds to roughly 37% in Jun-24, and ends near 7% in Jun-26.
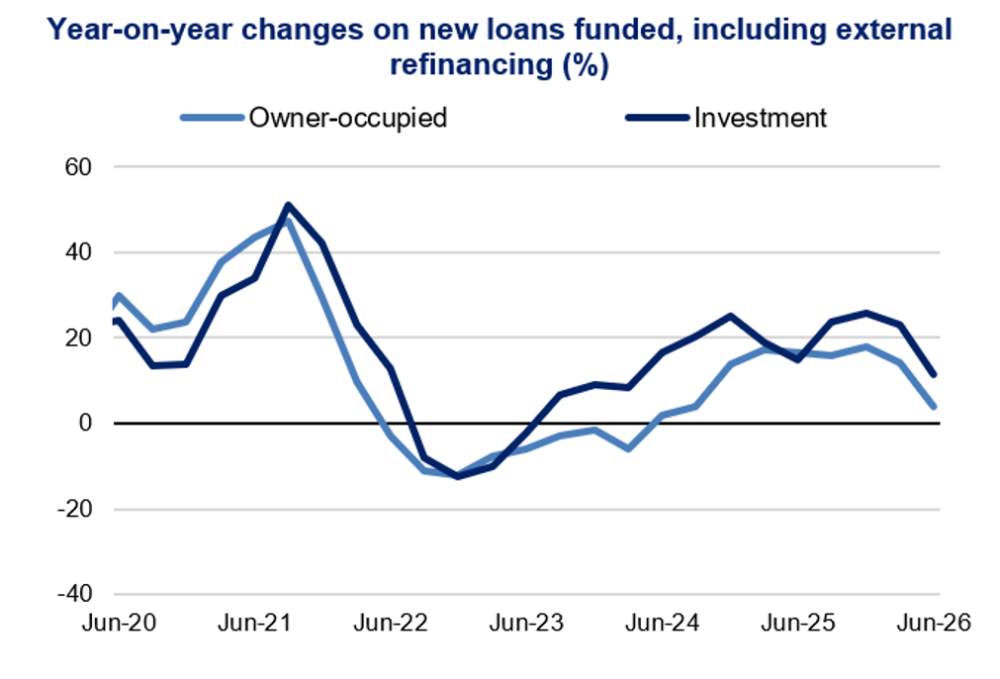
Line chart shows year-on-year changes in new loans funded, including external refinancing, for owner-occupied and investment properties from June 2020 to June 2026. Light-blue owner-occupied and dark-blue investment lines peak around mid-2021, fall below zero in 2022, then recover, with investment reaching about 25% in 2025 before both decline by June 2026.
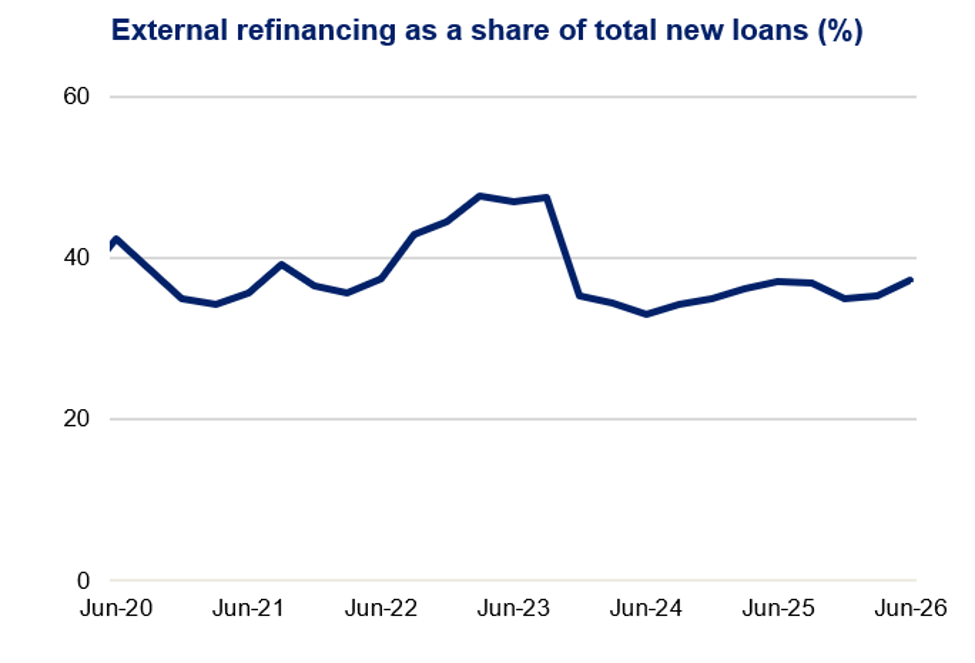
Line chart showing external refinancing as a share of total new loans from Jun-20 to Jun-26, with percentage axis marked 0, 20, 40, and 60. Dark-blue line rises from about 42% to nearly 48% in mid-2023, drops sharply to roughly 35%, reaches a low near 33% in 2024, then recovers to about 37% by Jun-26.
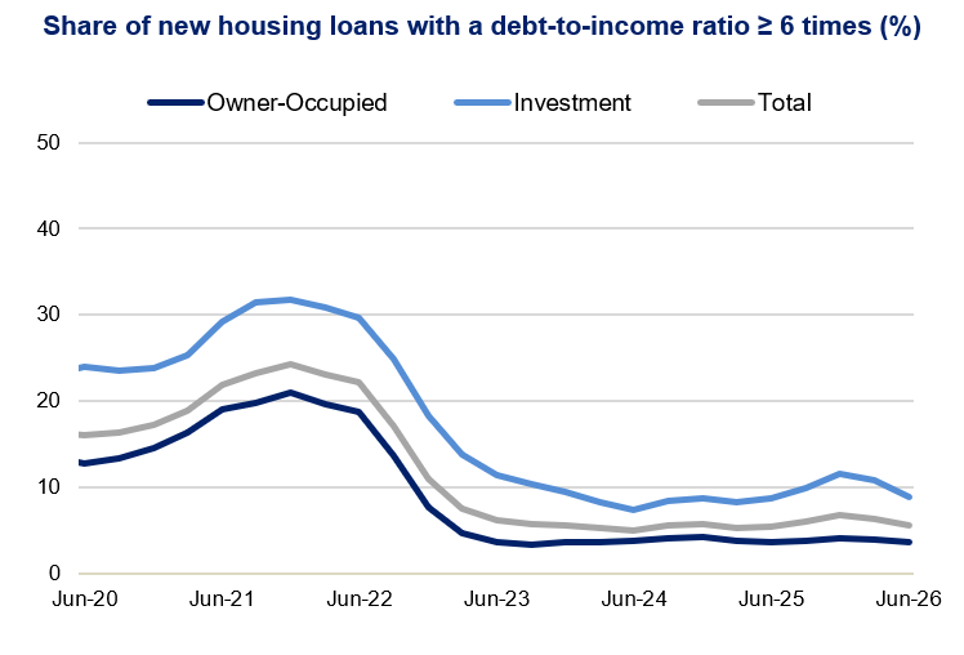
Line chart shows share of new housing loans with debt-to-income ratios at least six times, covering Jun 2020–Jun 2026. Investment loans, light blue, peak near 32% in 2021 before falling to about 7% in 2024 and ending near 9%; owner-occupied, dark blue, and total, gray, follow similar declines, with total peaking near 24% in 2021.
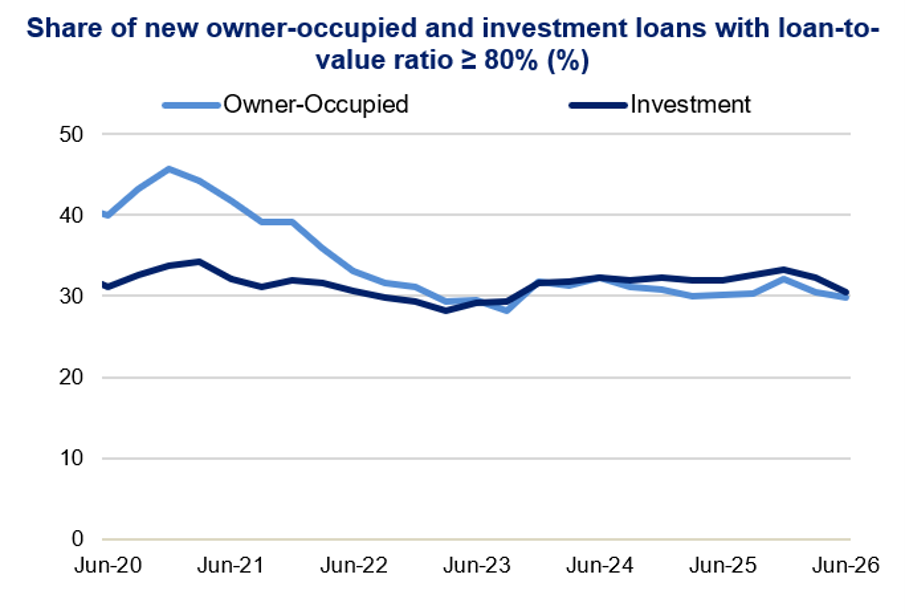
Line chart showing share of new owner-occupied and investment loans with loan-to-value ratios of at least 80%, measured monthly from June 2020 to June 2026. Light-blue owner-occupied loans peak near 46% in 2020 before declining to about 30%, while dark-blue investment loans peak near 34% and remain near 30% in recent periods.
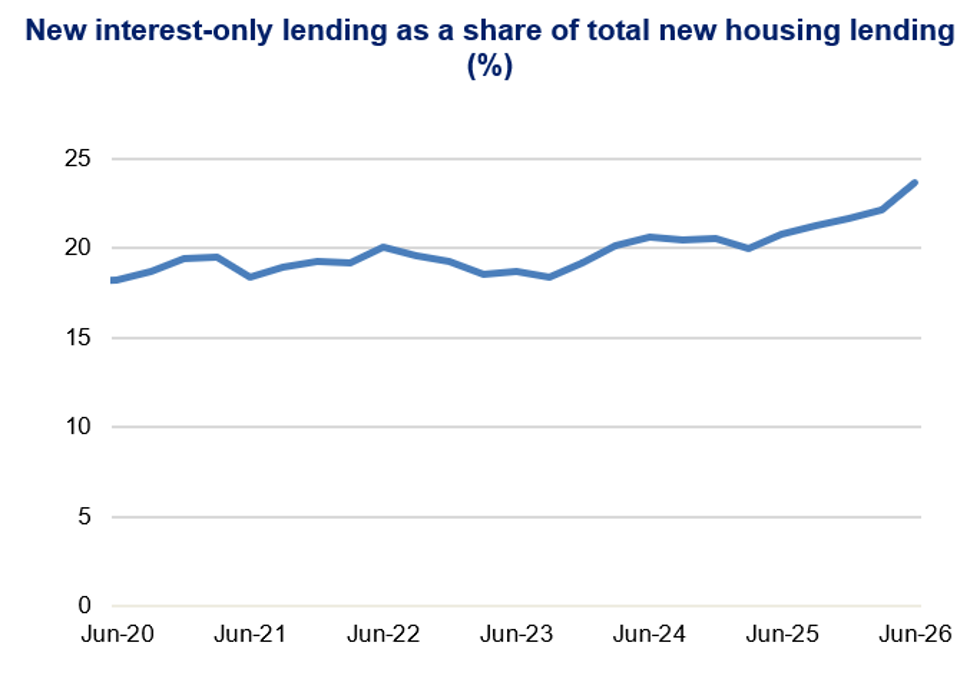
Line chart showing new interest-only lending as a share of total new housing lending, measured in percent, from Jun-20 to Jun-26. Blue line rises overall from about 18% to 23.5%, with dips around Jun-21, Jun-23, and Jun-25 and a sharp increase near Jun-26.
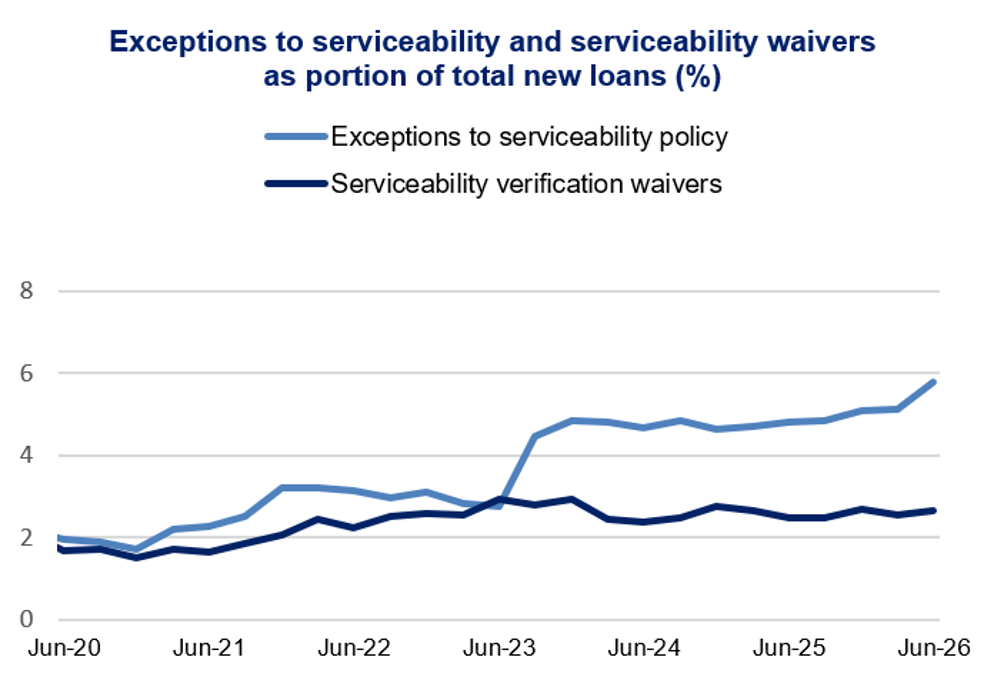
Line chart showing exceptions to serviceability policy and serviceability verification waivers as percentages of total new loans from Jun-20 to Jun-26. Light-blue exceptions rise from about 2% to 5.8%, while dark-blue waivers fluctuate near 2%–3%, with widening gap after Jun-23.

Residential mortgages: outstanding credit
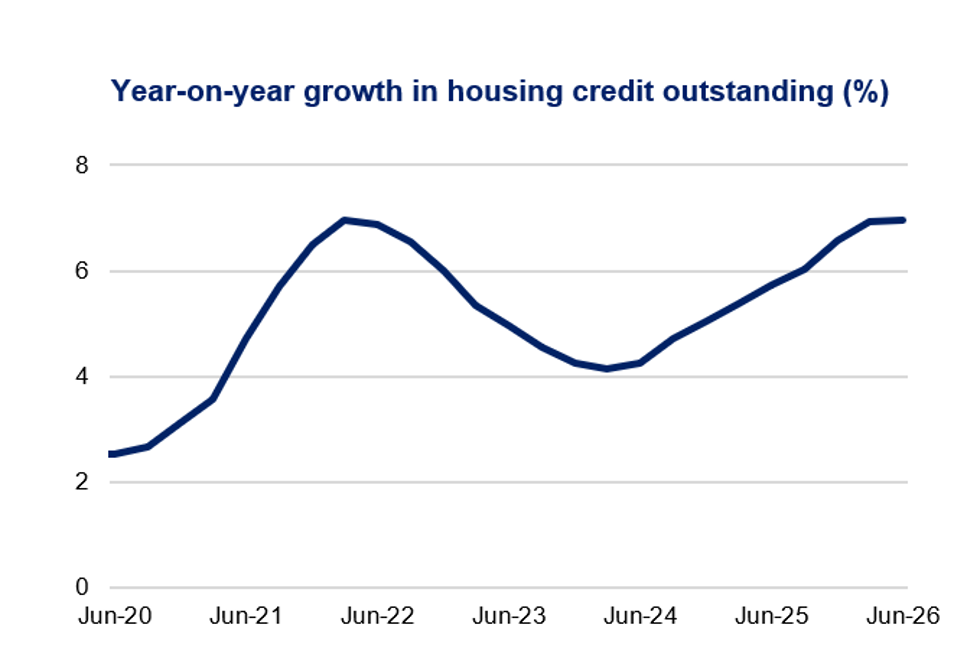
Line graph showing year-on-year growth in housing credit outstanding from Jun-20 to Jun-26, measured as a percentage. Navy line rises from about 2.5% to nearly 7% in Jun-22, declines to roughly 4.1% in Jun-24, then recovers to about 7% by Jun-26.
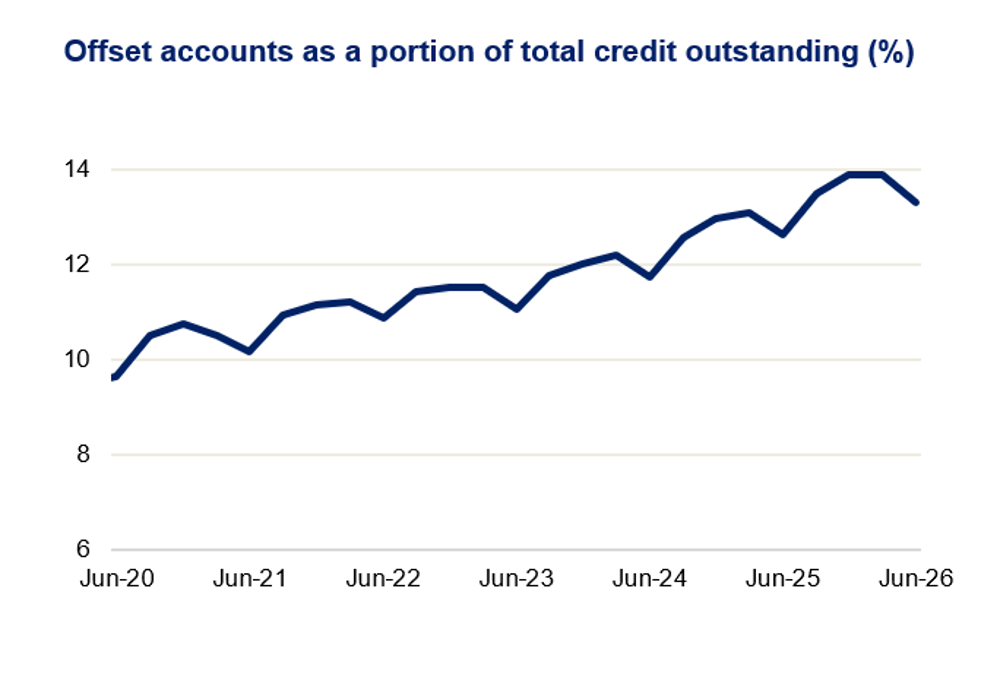
Line chart titled “Offset accounts as a portion of total credit outstanding (%)” tracks monthly values from Jun-20 to Jun-26 across a 6–14% vertical scale. Navy line trends upward from about 9.5% to 13.3%, peaks near 13.9% in late 2025, then declines slightly by Jun-26.
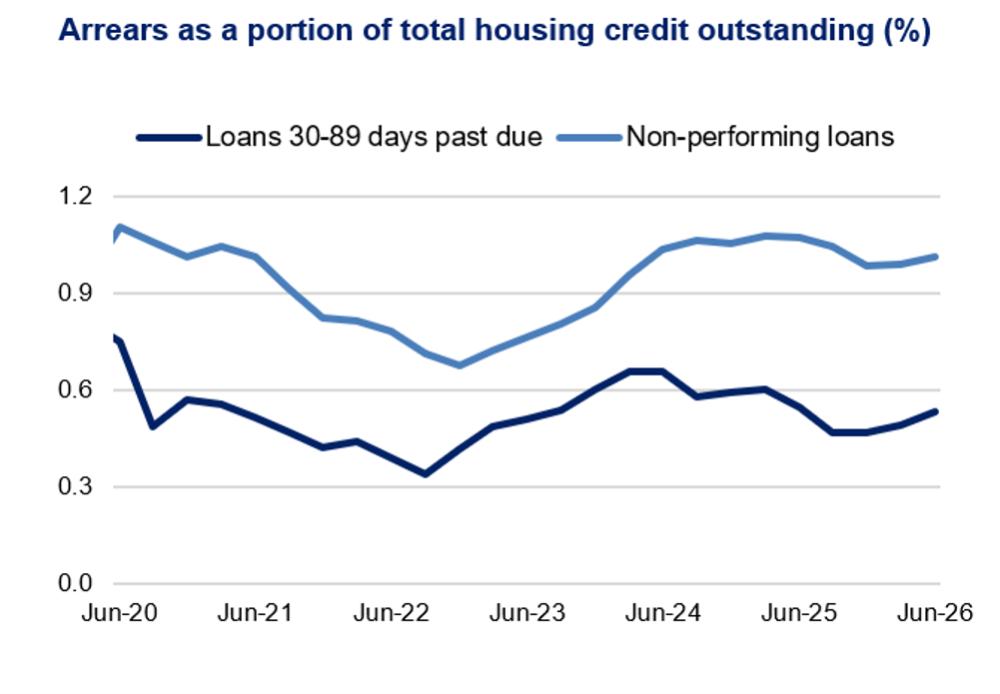
Line chart showing arrears as a percentage of total housing credit outstanding from Jun-20 to Jun-26, with dark blue lines for loans 30–89 days past due and light blue lines for non-performing loans. Non-performing loans decline from about 1.1% to 0.7% by mid-2022, then recover near 1.1% in 2024–25, while 30–89-day arrears bottom near 0.3% in 2022 before rising to roughly 0.5% by Jun-26.
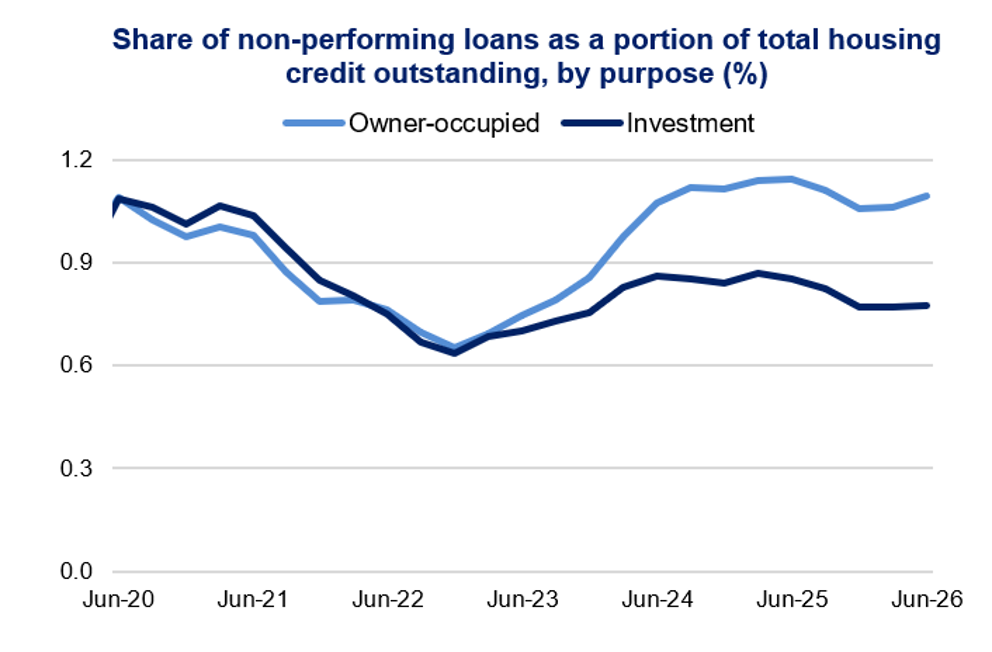
Line chart compares shares of non-performing loans within total housing-credit outstanding by purpose from June 2020 through June 2026, using a 0.0–1.2% vertical scale. Light-blue Owner-occupied loans decline to about 0.65% in 2022, rise near 1.15% in 2025, and end around 1.1%, while dark-blue Investment loans recover to about 0.87% in 2024 before ending near 0.78%.
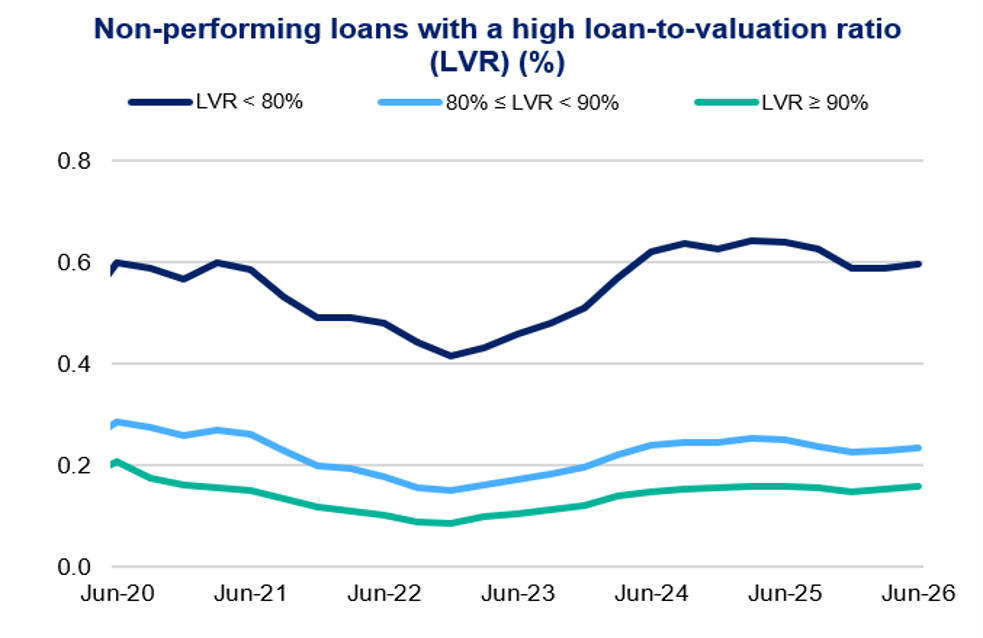
Line chart tracks non-performing loans by loan-to-value ratio (LVR), June 2020–June 2026, across three LVR bands. Dark navy LVR <80% falls from 0.60 to 0.41 in mid-2022, rises to about 0.64 in 2024–25, and ends near 0.59; light blue 80% ≤ LVR <90% and green LVR ≥90% remain lower, ending near 0.23 and 0.16.

Commercial real estate

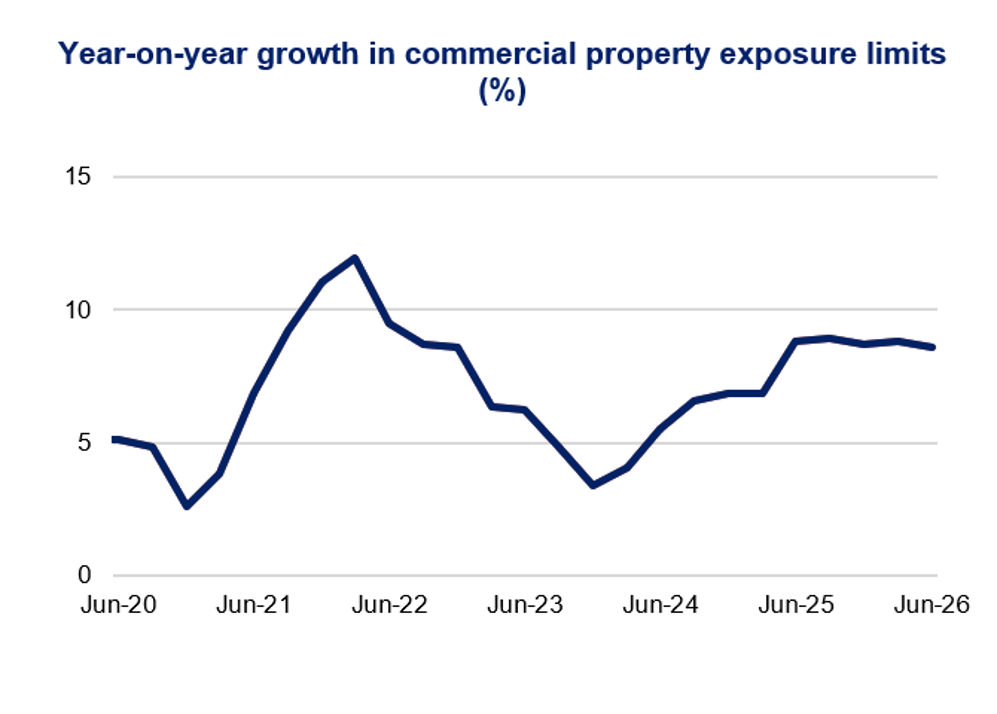
Line chart titled “Year-on-year growth in commercial property exposure limits (%)” tracks monthly growth from Jun-20 to Jun-26. Navy line falls from about 5% to 2.5% in late 2020, peaks near 12% in late 2021, declines to roughly 3% in late 2023, then recovers and stabilizes around 8.5–9% through Jun-26, with gridlines at 0%, 5%, 10%, and 15%.
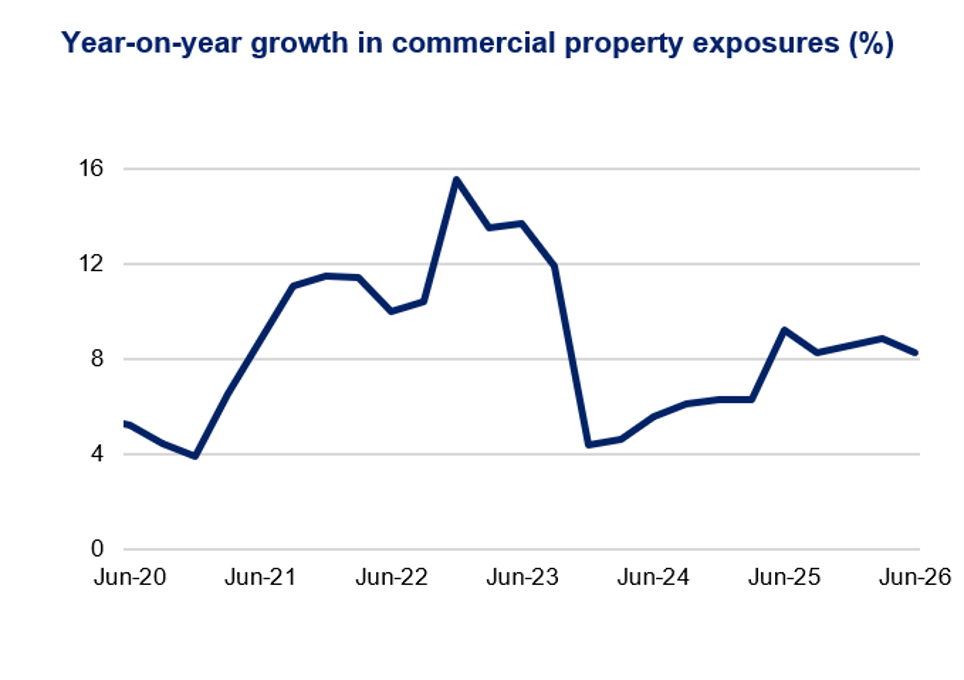
Line chart showing year-on-year growth in commercial property exposures from Jun-20 to Jun-26, measured in percent. Growth rises from about 5% to nearly 16% in mid-2022, plunges to roughly 4% in late 2023, then recovers to around 9% before easing to 8% by Jun-26.
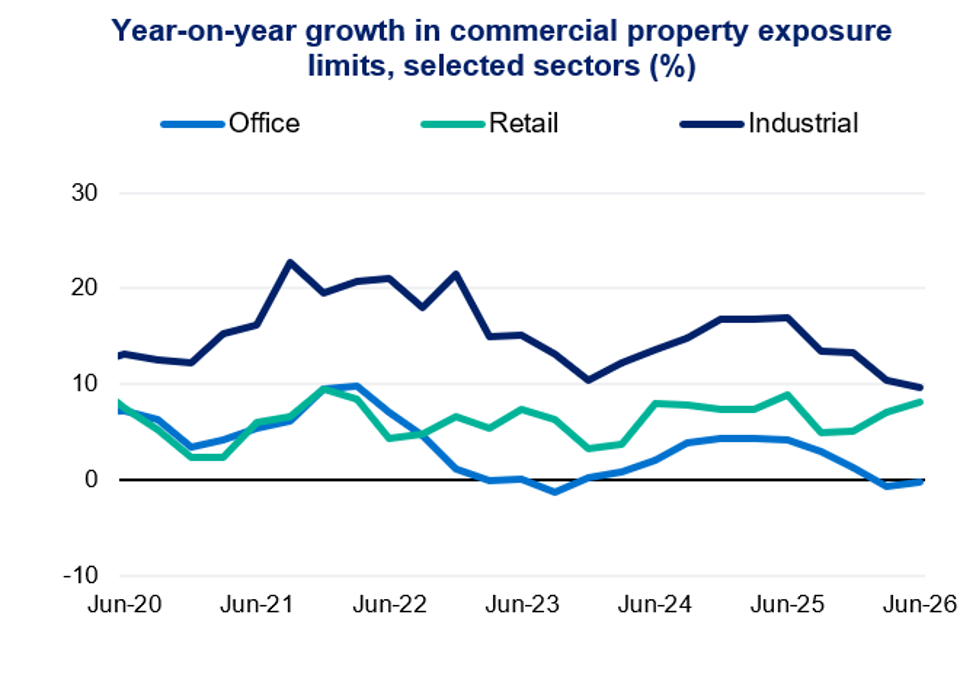
Line chart showing year-on-year growth in commercial property exposure limits across office, retail, and industrial sectors from Jun 2020 to Jun 2026. Industrial growth remains highest, peaking near 23% in 2021 and ending near 9%; retail fluctuates between 2% and 9%, while office falls from about 9% to near -1% after a brief 2022 peak.
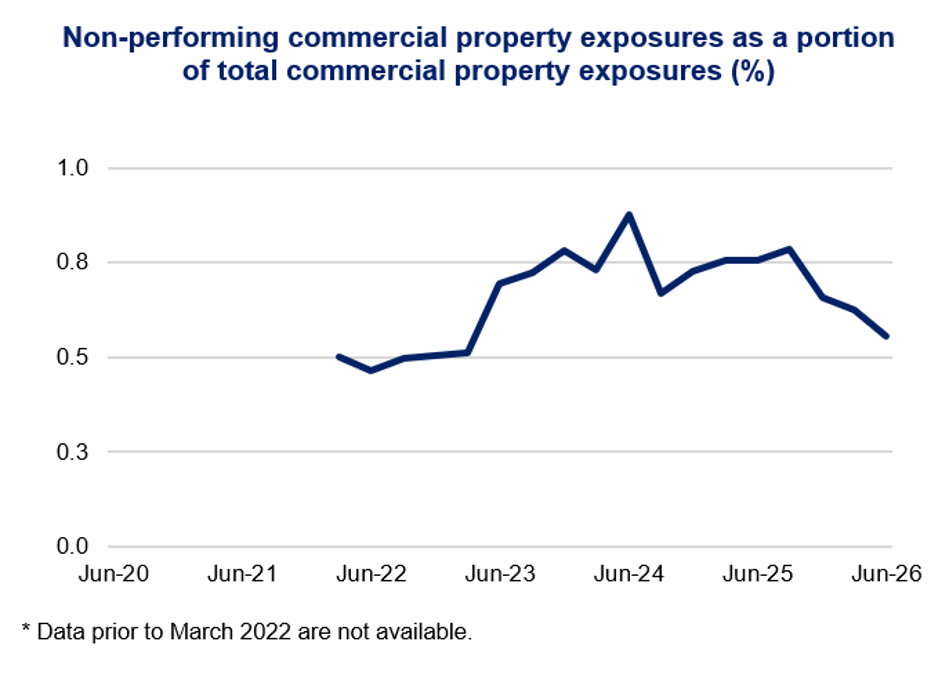
Line chart showing non-performing commercial property exposures as a percentage of total commercial property exposures, spanning Jun-22 through Jun-26. Navy line rises from about 0.50% in Jun-22 to a peak near 0.90% around Jun-24, fluctuates near 0.80% through Jun-25, then declines to roughly 0.55% by Jun-26; data before March 2022 unavailable.

Footnotes