
Statistical publication

Quarterly authorised deposit-taking institution performance statistics - June 2026 highlights

Published
17 September 2026

Key statistics

Excludes ADIs that are not banks, building societies or credit unions, such as payment providers. The year-on-year change are calculated using the underlying unrounded values.

 June 2025June 2026Year-on-year change
Net profit after tax (year-end) ($bn)39.642.57.5%
Total assets ($bn)6,673.07,074.36.0%
Total capital base ($bn)462.9480.03.7%
Total risk-weighted assets ($bn)2,269.32,339.03.1%
Total capital ratio20.4%20.5%0.13 points
Liquidity coverage ratio130.0%133.0%3.01 points
Minimum liquidity holdings ratio16.3%16.0%-0.32 points
Net stable funding ratio116.2%114.5%-1.67 points

Financial performance

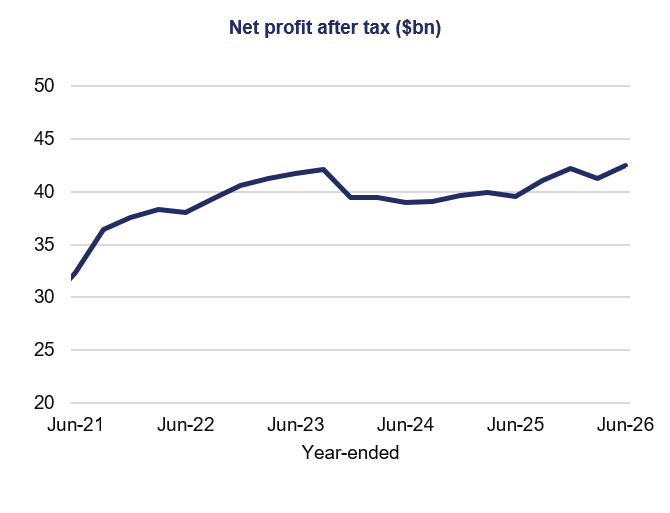
Line chart tracks net profit after tax ($bn) from Jun-21 to Jun-26, using a dark-blue line, horizontal gridlines, and y-axis values from 25 to 50. Profit rises from about $32bn to a mid-2023 peak near $42bn, drops to roughly $39bn, then recovers with fluctuations to about $42.5bn by Jun-26.
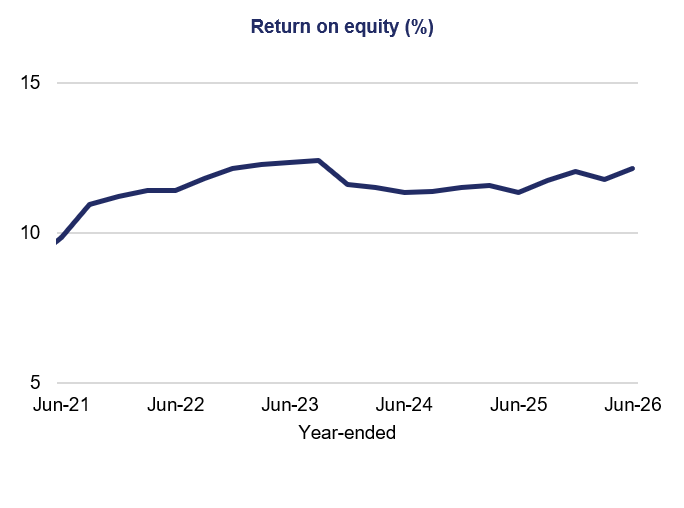
Line chart titled “Return on equity (%)” tracks year-ended ROE from Jun-21 to Jun-26. Navy line rises from about 10% to 12.5% by Jun-23, dips near 11.3% in Jun-24, then fluctuates around 11.5–12.2% through Jun-26.
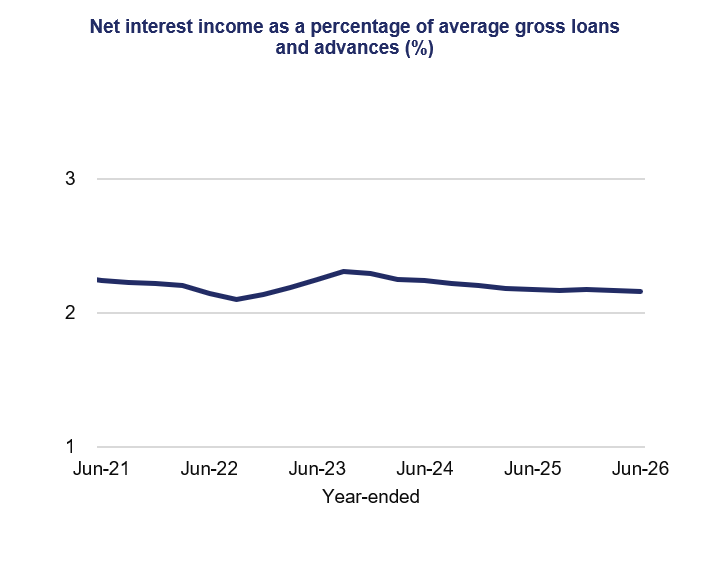
Line graph showing net interest income as a percentage of average gross loans and advances from Jun-21 through Jun-26. Navy line starts near 2.2%, dips to about 2.1% in Jun-22, peaks near 2.3% in Jun-23, then gradually settles around 2.15% by Jun-26.
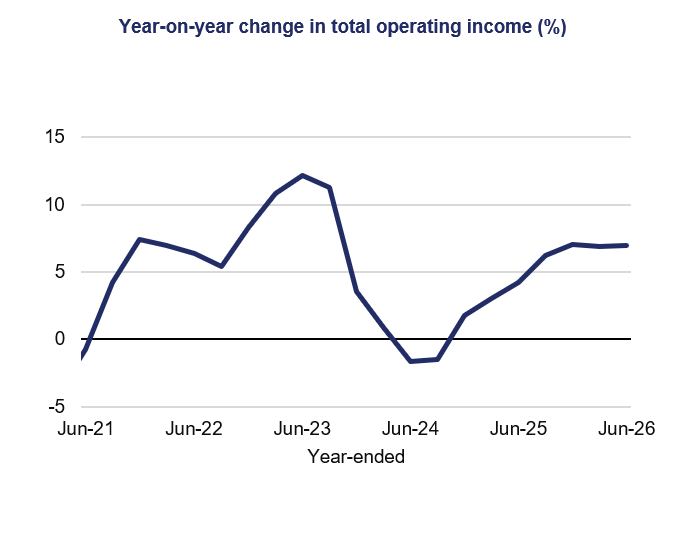
Line chart titled “Year-on-year change in total operating income (%)” tracks annual change from Jun-21 to Jun-26, using a navy line, percentage y-axis, and year-ended x-axis. Values rise from about −1% in Jun-21 to 12% around Jun-23, fall below zero near Jun-24, then recover to roughly 7% by Jun-26.
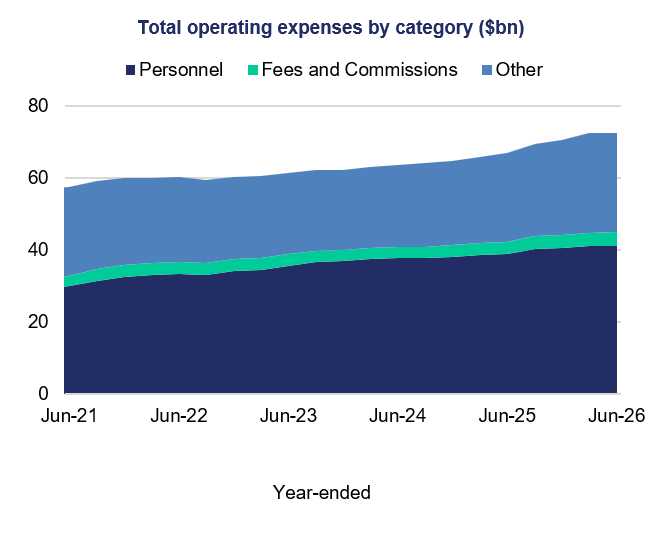
Stacked area chart shows total operating expenses by category ($bn), year-ended Jun-21 through Jun-26. Personnel (navy) rises from about $30bn to $40bn, Fees and Commissions (green) stays near $3–4bn, and Other (blue) brings total expenses from roughly $58bn to $72bn.
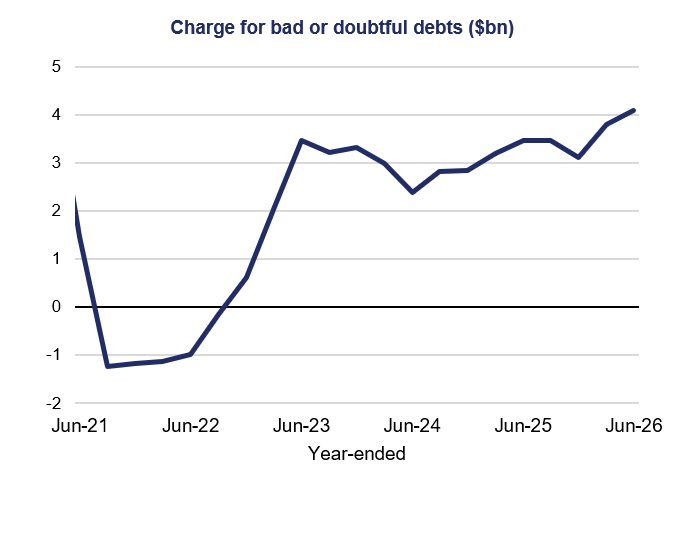
Line chart titled “Charge for bad or doubtful debts ($bn)” tracks year-ended values from Jun-21 to Jun-26. Navy line falls from about $2.1bn to –$1.2bn in Jun-21, then rises with fluctuations to roughly $4.1bn by Jun-26; horizontal zero line marks positive versus negative charges.

Asset quality

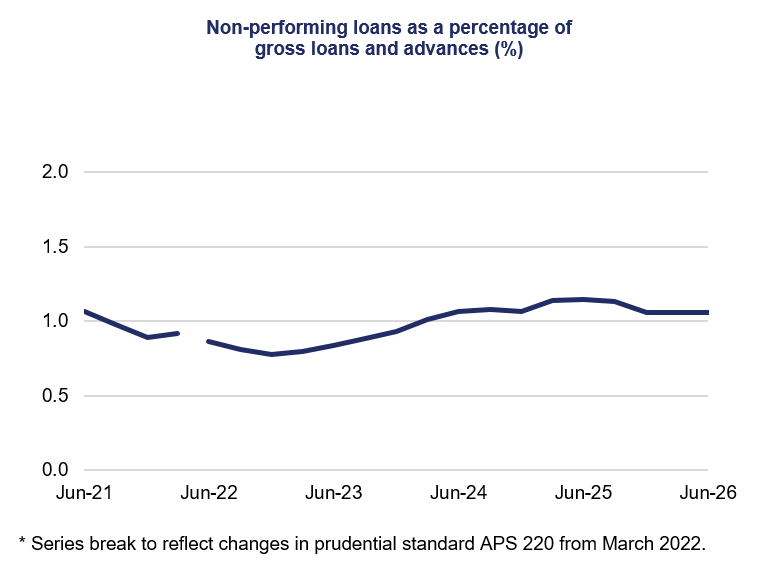
Line chart tracks non-performing loans as a percentage of gross loans and advances from Jun-21 to Jun-26. Rate falls from about 1.05% to 0.8%, rises near 1.1% by Jun-25, then stabilizes near 1.05%; series break appears between Jun-21 and Jun-22 due to APS 220 prudential-standard changes from March 2022.
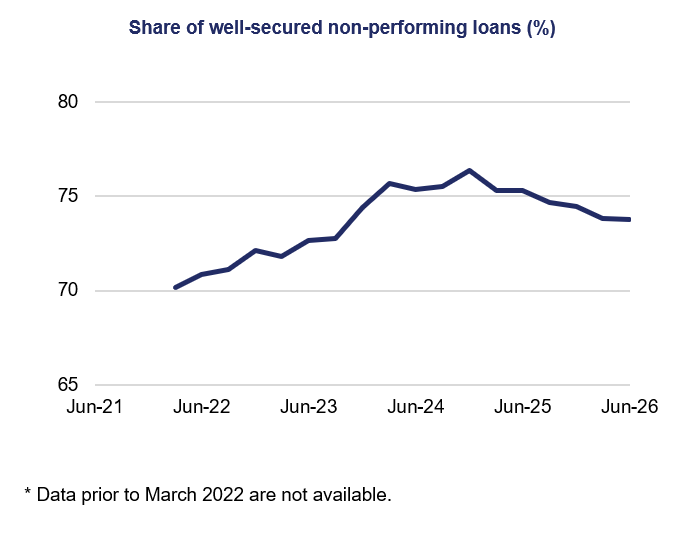
Line chart titled “Share of well-secured non-performing loans (%)” shows quarterly values from Jun-21 through Jun-26, with 65–80% y-axis gridlines and Jun-22–Jun-26 x-axis labels. Navy trend rises from 70% in 2022 to roughly 76% in mid-2024, then declines to about 74% by late 2025; note states data before March 2022 are unavailable.

Capital adequacy

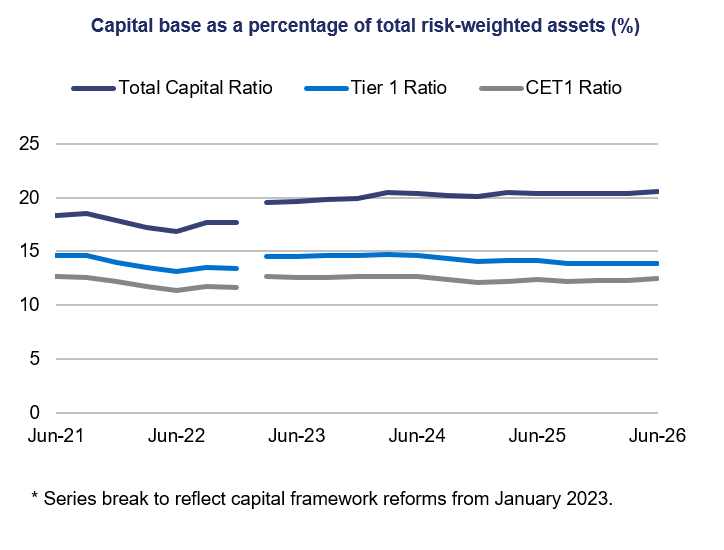
Line chart titled “Capital base as a percentage of total risk-weighted assets (%)” tracks Total Capital Ratio, Tier 1 Ratio, and CET1 Ratio from Jun-21 to Jun-26. Navy Total Capital Ratio rises from about 18% to 20%, blue Tier 1 Ratio stays near 14–15%, gray CET1 Ratio remains near 11–12%, with a visible series break at Jan-23 marking capital framework reforms.
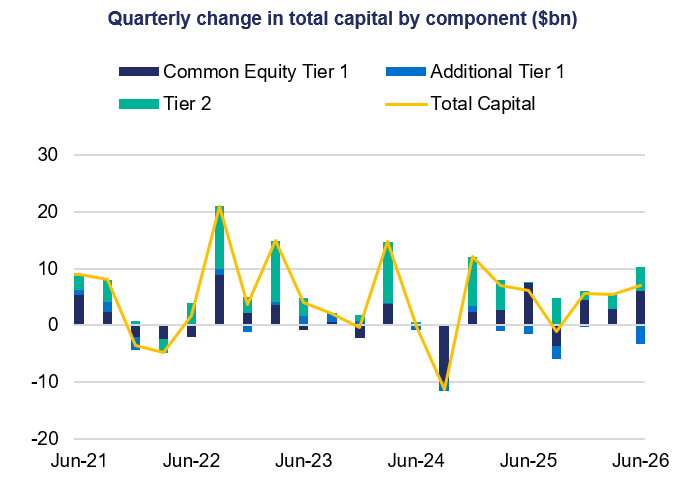
Line-and-stacked-column chart showing quarterly change in total capital by component from Jun-21 to Jun-26, measured in billions of dollars. Navy, blue, and teal bars represent Common Equity Tier 1, Additional Tier 1, and Tier 2, while orange line tracks total capital, peaking near $20 billion in late 2022 and falling to about −$12 billion in mid-2024.
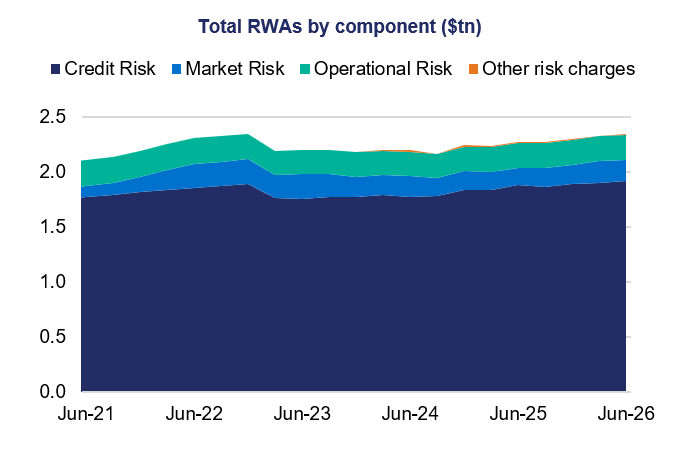
Stacked area chart titled “Total RWAs by component ($tn)” shows risk-weighted assets from Jun-21 through Jun-26. Credit Risk, dark navy, dominates and rises from about $1.75tn to $1.9tn; Market Risk, blue, Operational Risk, teal, and Other risk charges, orange, bring total RWAs from roughly $2.1tn to $2.3tn.
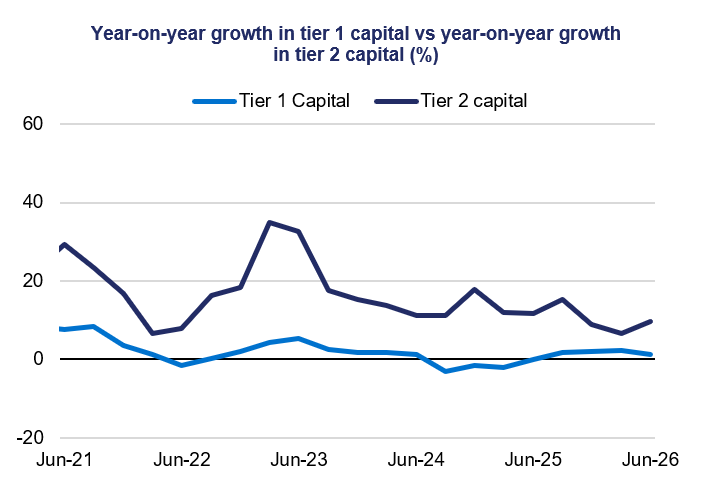
Line chart compares year-on-year growth for Tier 1 and Tier 2 capital from Jun-21 to Jun-26, measured in percent. Blue Tier 1 growth stays near zero, briefly turns negative around Jun-22 and Jun-24, while navy Tier 2 growth peaks near 35% in late 2022 before declining toward single digits by Jun-26.

Liquidity

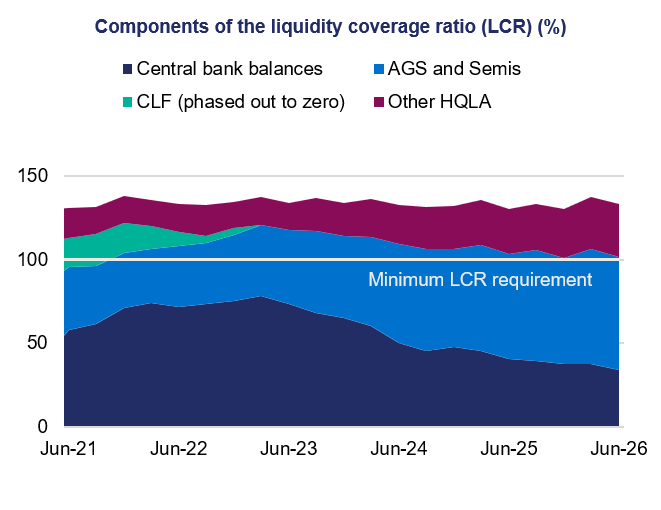
Stacked area chart shows liquidity coverage ratio (LCR) components from Jun-21 to Jun-26, with a 100% minimum LCR requirement marker. Central bank balances (dark blue) decline after mid-2023, while AGS and Semis, CLF, and Other HQLA maintain total LCR near 125–135%.
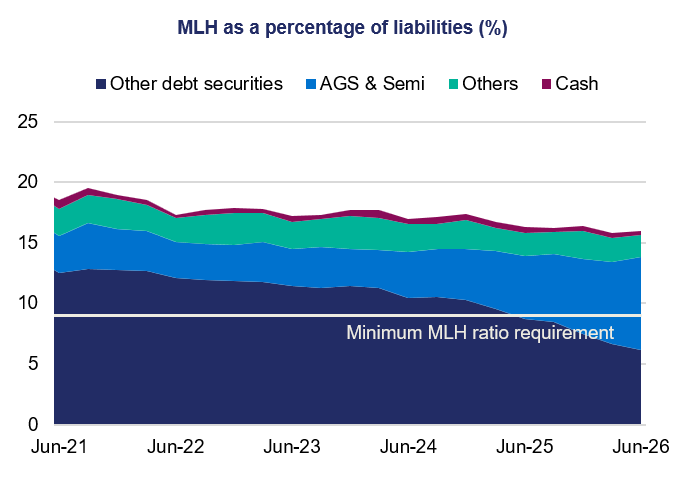
Stacked area chart shows MLH as a percentage of liabilities from Jun-21 to Jun-26, segmented into Other debt securities (navy), AGS & Semi (blue), Others (teal), and Cash (magenta). Total MLH declines from roughly 18–19% to 15–16%, while a 9% horizontal marker indicates minimum MLH ratio requirement.
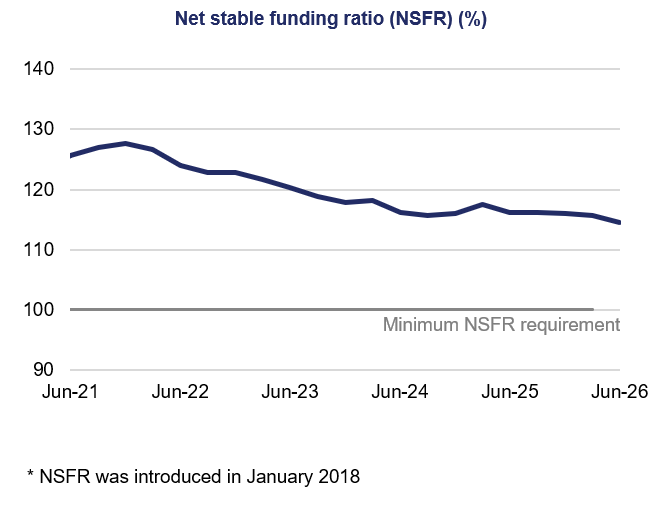
Line chart tracks net stable funding ratio (NSFR) from Jun-21 to Jun-26 against 100% minimum NSFR requirement. Navy line peaks near 128% in late 2021, trends downward to about 114% by Jun-26, and remains above gray benchmark; footnote notes NSFR introduced January 2018.

Financial position

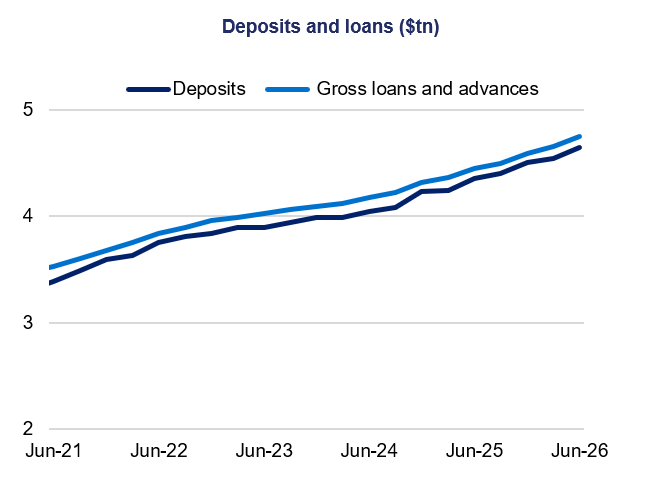
Line chart titled “Deposits and loans ($tn)” tracks deposits and gross loans and advances from Jun-21 to Jun-26. Dark-blue deposits and light-blue loans rise steadily from roughly $3.4–$3.5 trillion to $4.6–$4.8 trillion, with loans remaining slightly above deposits.
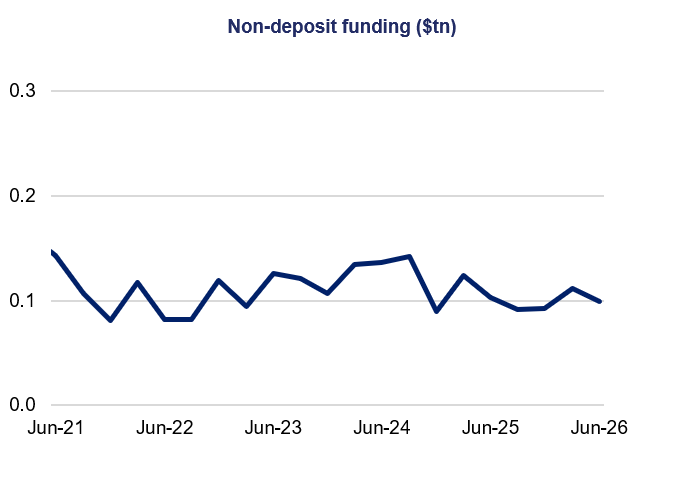
Line chart titled “Non-deposit funding ($tn)” tracks funding from Jun-21 to Jun-26, using a navy line and 0.0–0.3 trillion y-axis scale. Values fluctuate between approximately $0.08tn and $0.15tn, peak near mid-2024, then decline before ending near $0.10tn in Jun-26.

Footnotes