

Key statistics
Excludes ADIs that are not banks, building societies or credit unions. See ‘Explanatory Notes’ of the Quarterly authorised deposit-taking institution property exposures statistics (excel file) for details of share calculations.
Key residential mortgage lending statistics for ADIs for the quarter were:
| ADIs' residential property exposures | June 2025 | June 2026 | Year-on-year change |
|---|---|---|---|
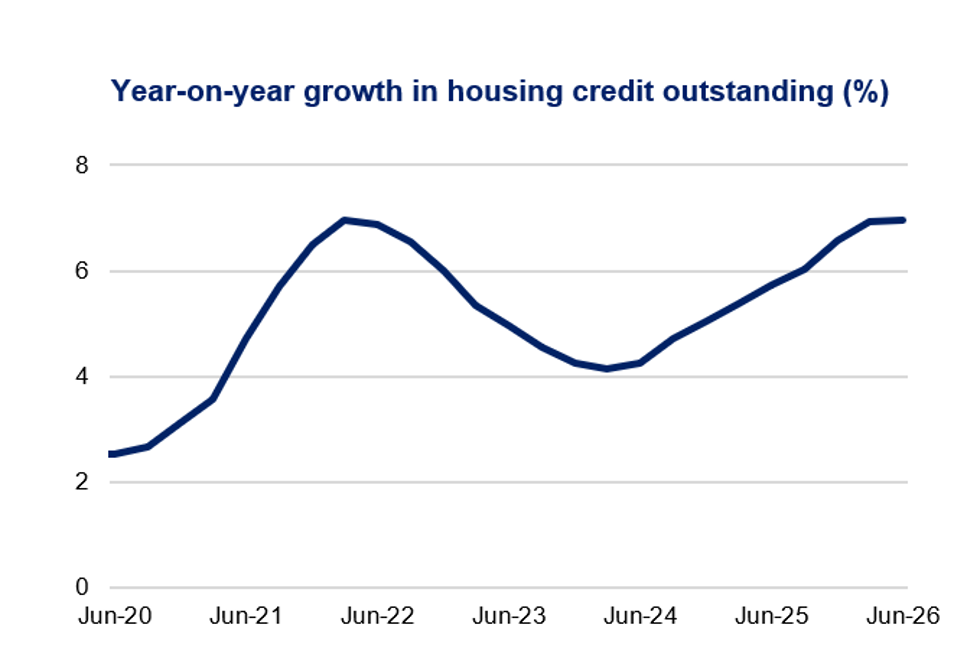
| Total credit outstanding ($bn) | 2,391.8 | 2,558.5 | 7.0% |
| Owner-occupied loans - share | 67.5% | 66.7% | -0.8 points |
| Investment loans - share | 30.5% | 31.2% | 0.72 points |
| Loans with loan-to-valuation ratio (LVR) ≥ 80 per cent - share | 17.6% | 16.7% | -0.9 points |
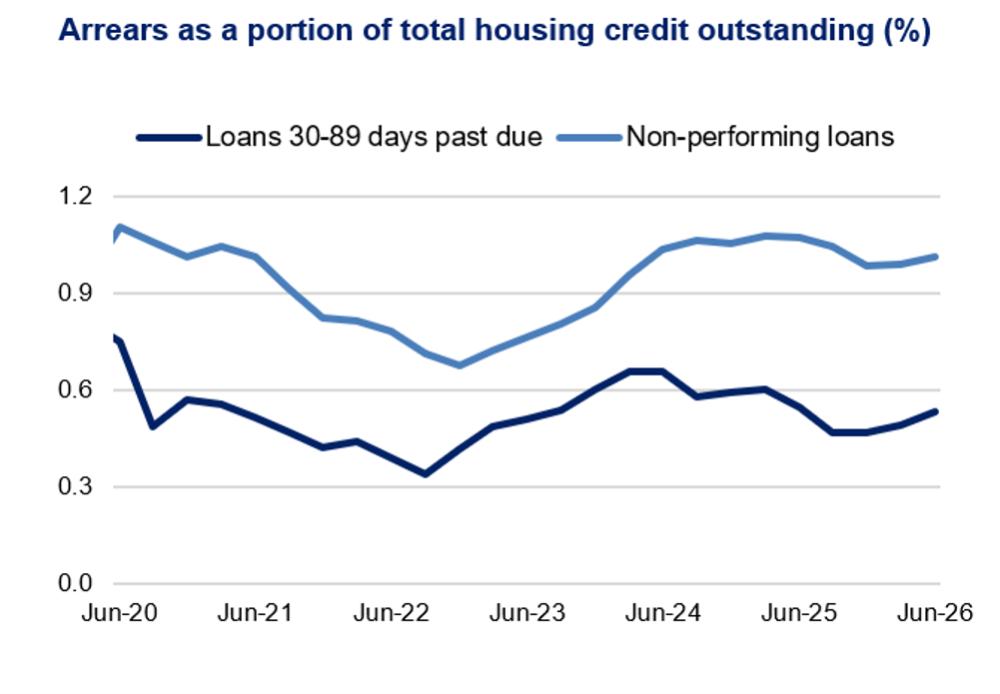
| Loans 30-89 days past due - share | 0.66% | 0.54% | -0.12 points |
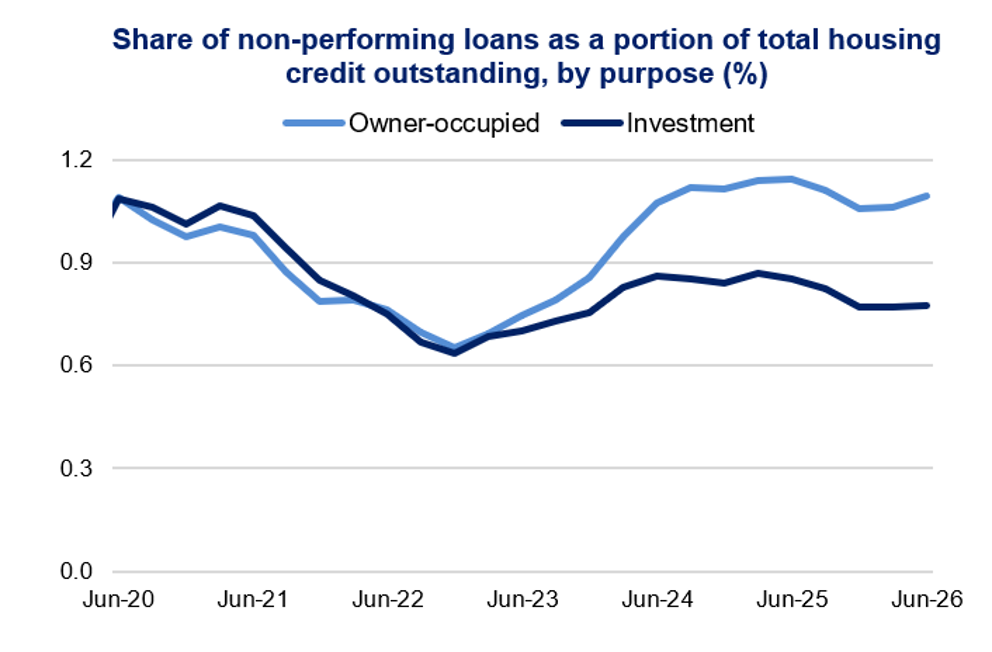
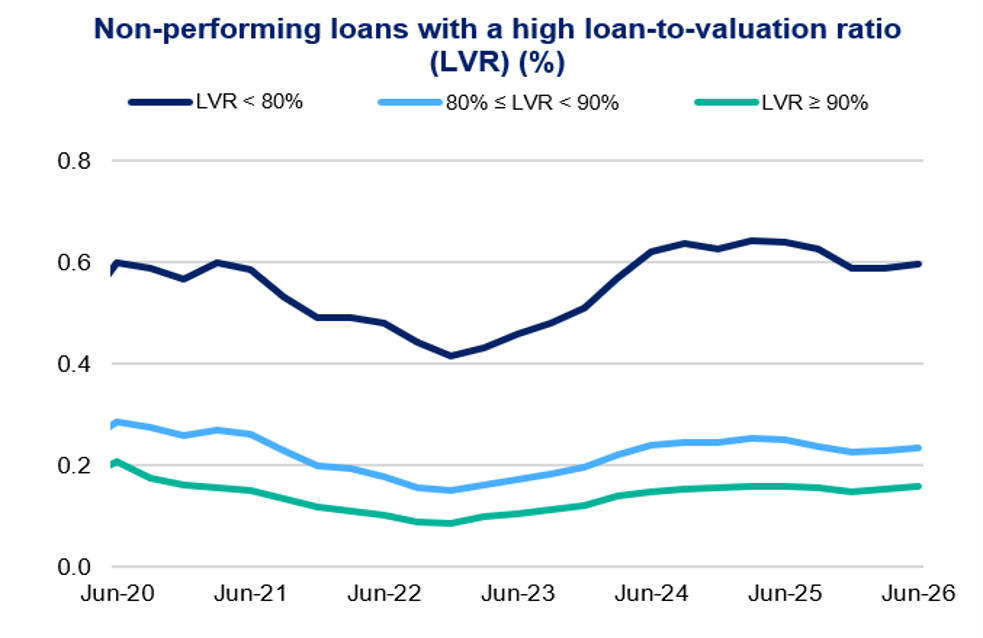
| Non-performing loans | 1.04% | 1.01% | -0.03 points |
| ADIs’ new loans funded during the quarter | June 2025 | June 2026 | Year-on-year change |
|---|---|---|---|
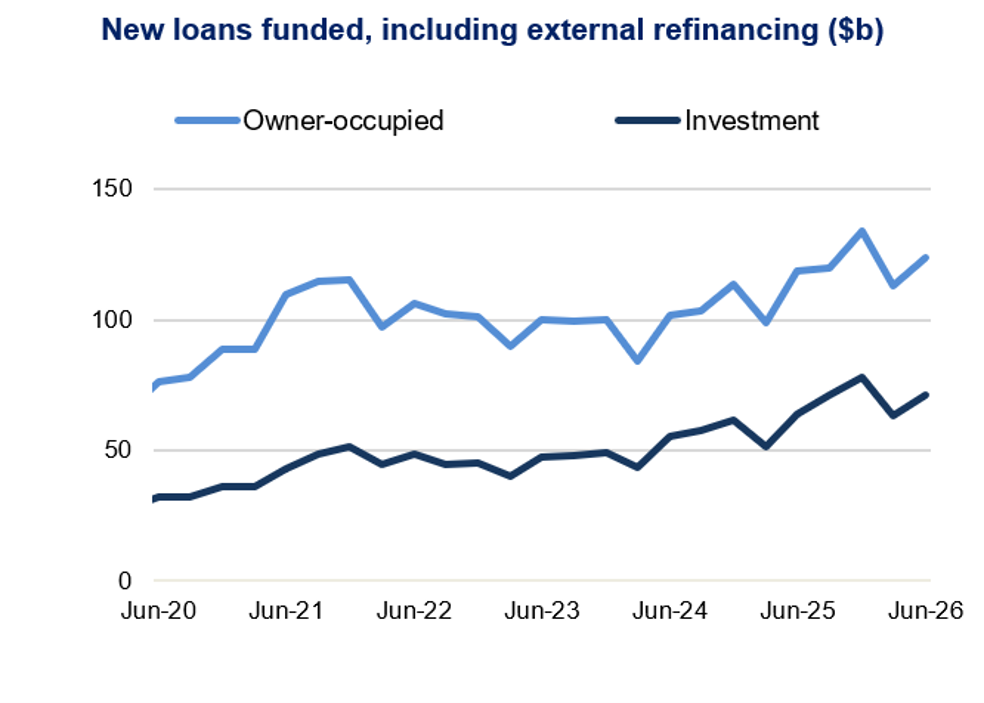
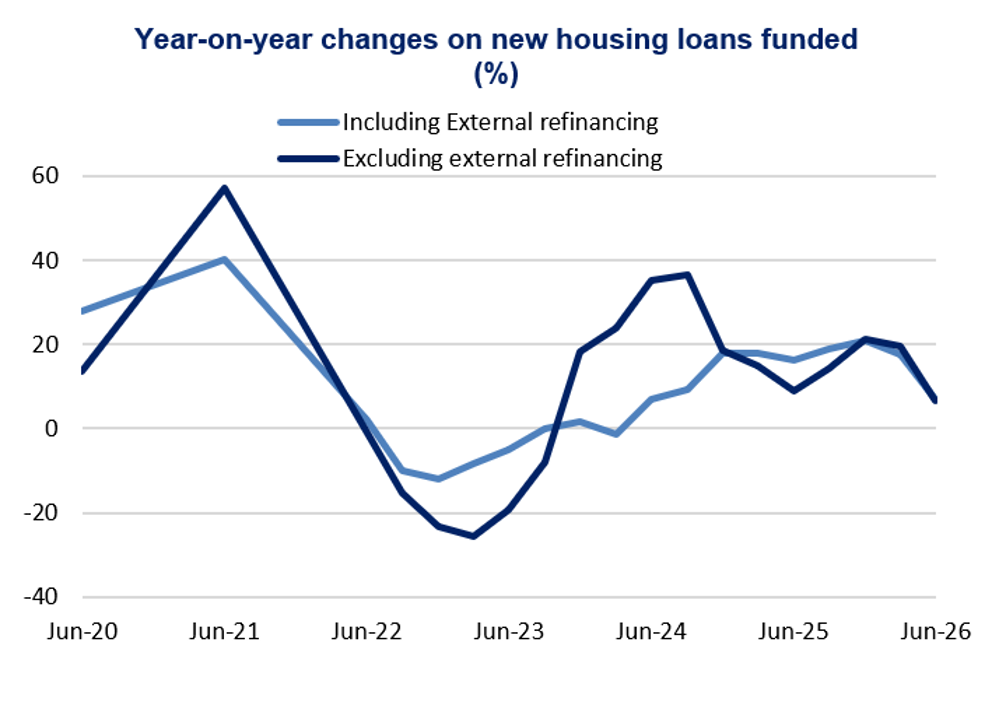
| New loans funded ($bn) | 187.6 | 200.5 | 6.8% |
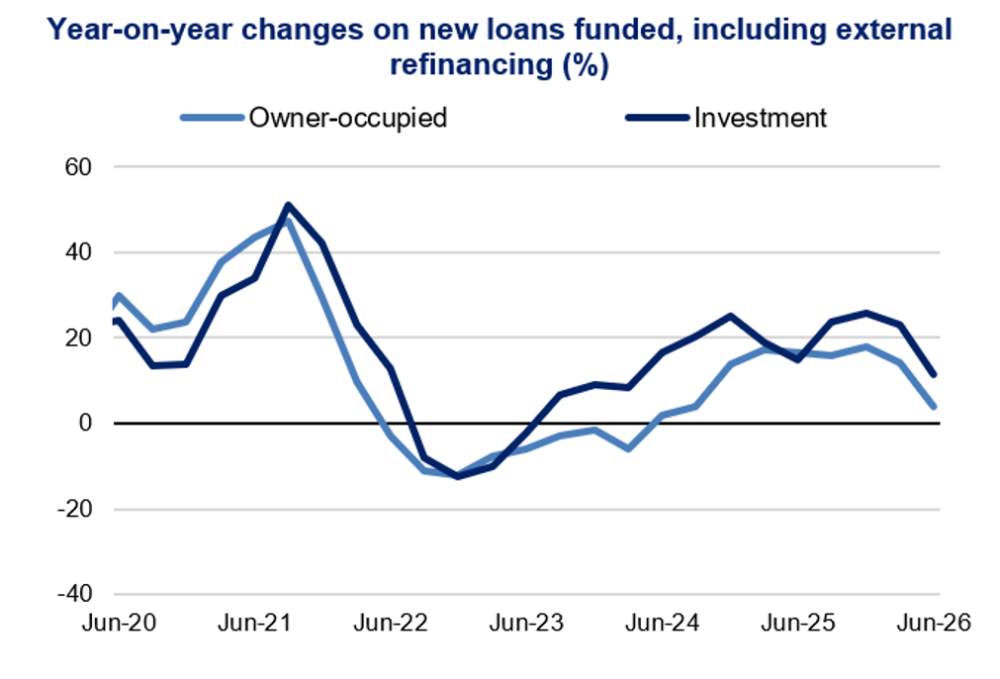
| New owner-occupied loans funded - share | 63.6% | 61.9% | -1.72 points |
| New investment loans funded - share | 34.1% | 35.6% | 1.48 points |
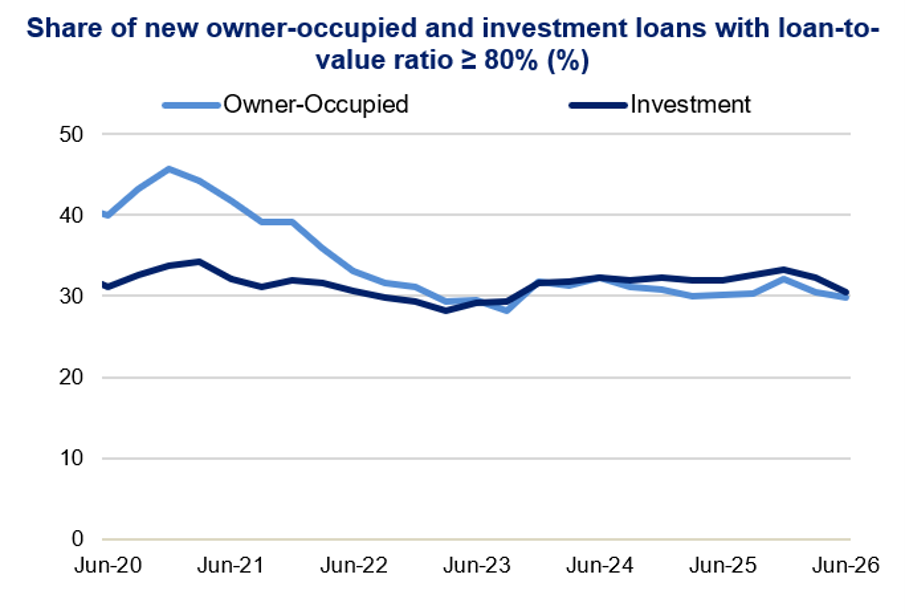
| New loans with LVR ≥ 80 per cent funded - share | 30.4% | 29.7% | -0.72 points |
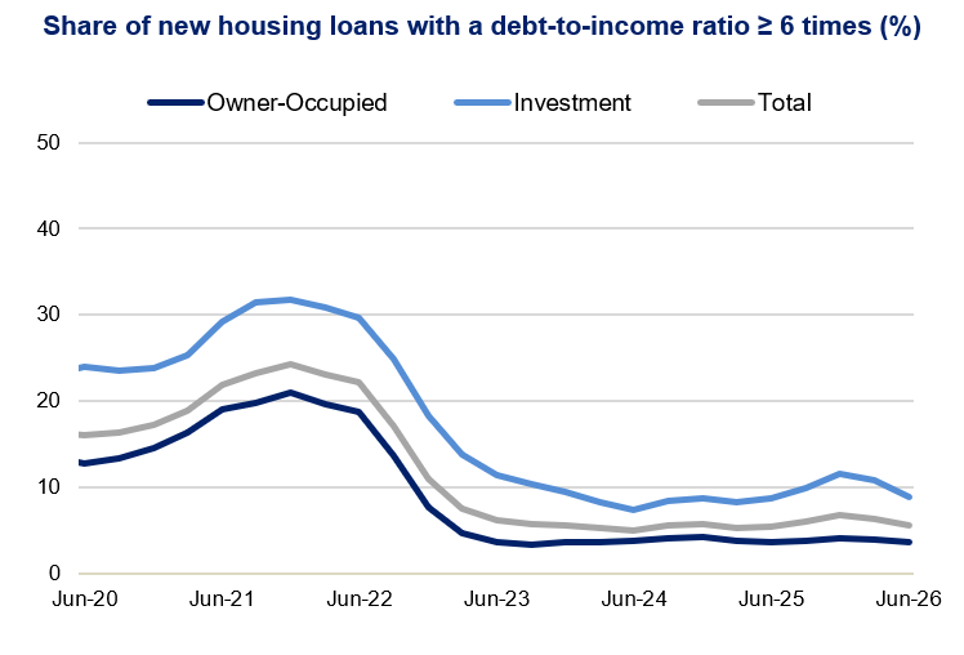
| New loans with debt-to-income (DTI) ratio ≥ 6x funded - share | 5.5% | 5.6% | 0.1 points |
| New owner-occupied loans with debt-to-income (DTI) ratio ≥ 6x funded - share | 3.7% | 3.7% | -0.04 points |
| New investment loans with debt-to-income (DTI) ratio ≥ 6x funded - share | 8.7% | 8.9% | 0.13 points |
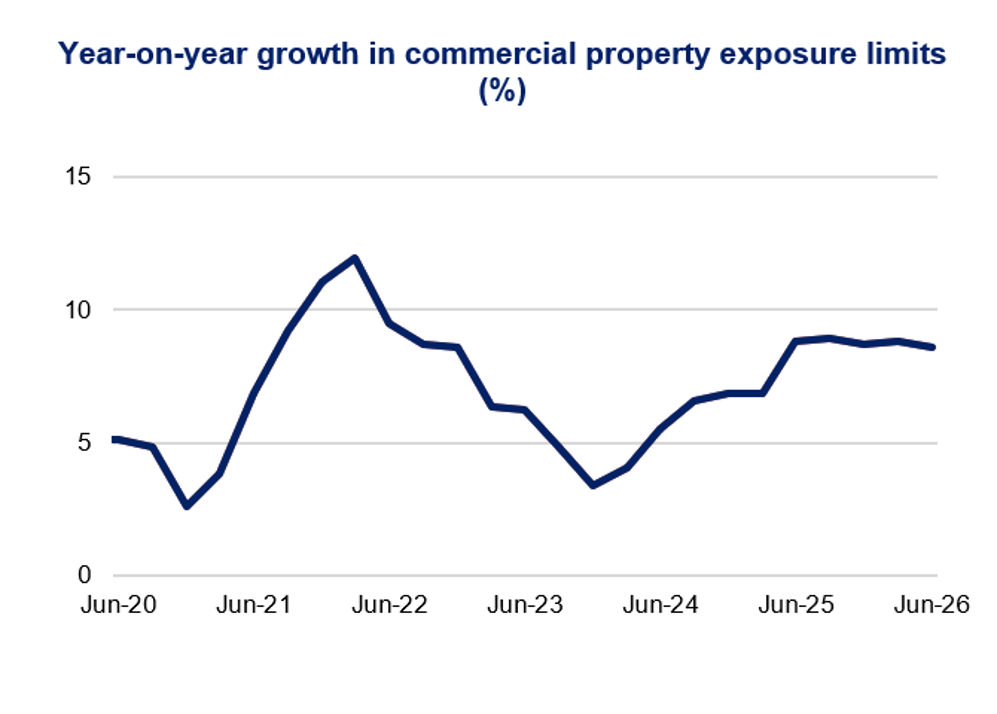
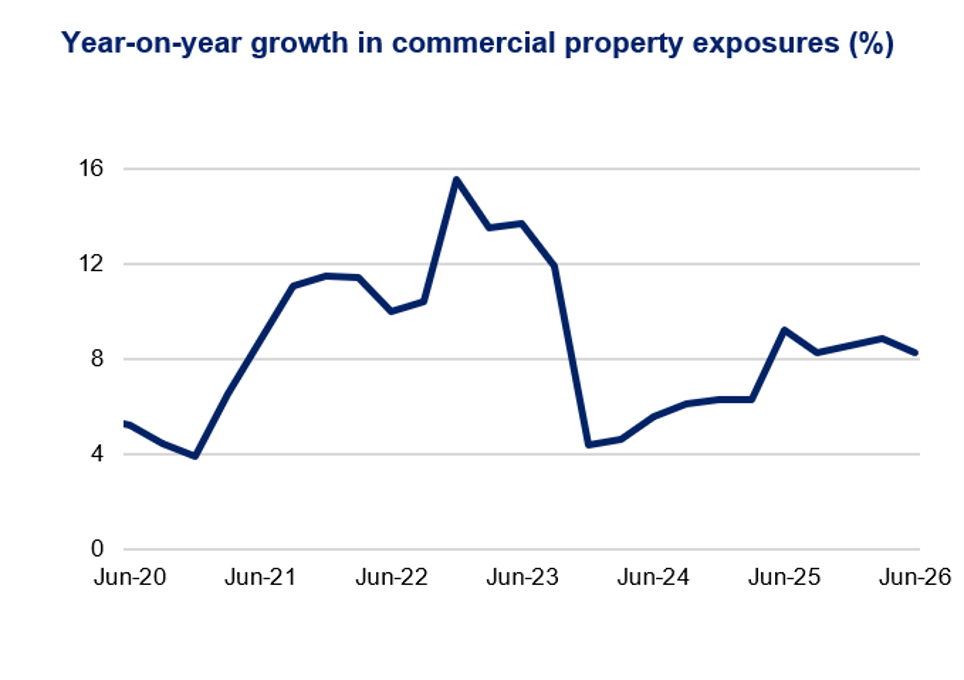
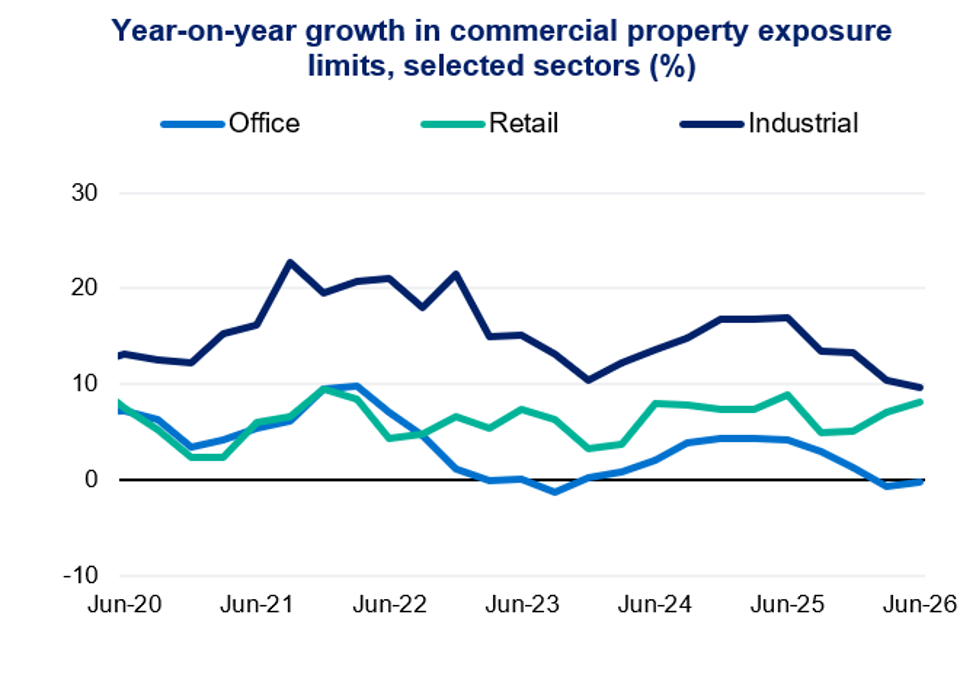
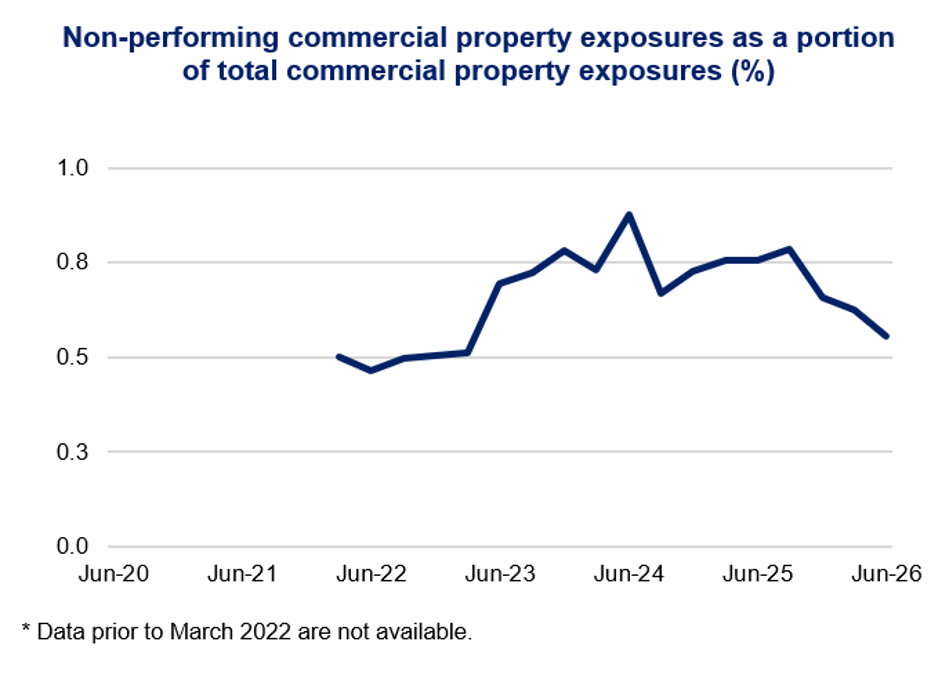
Key commercial property statistics for ADIs for the quarter were:
| ADIs’ commercial property exposures | June 2025 | June 2026 | Year-on-year change |
|---|---|---|---|
| Commercial property exposure limits ($bn) | 498.2 | 541.0 | 8.6% |
| Commercial property exposures ($bn) | 463.3 | 501.6 | 8.3% |
Residential mortgages: new lending
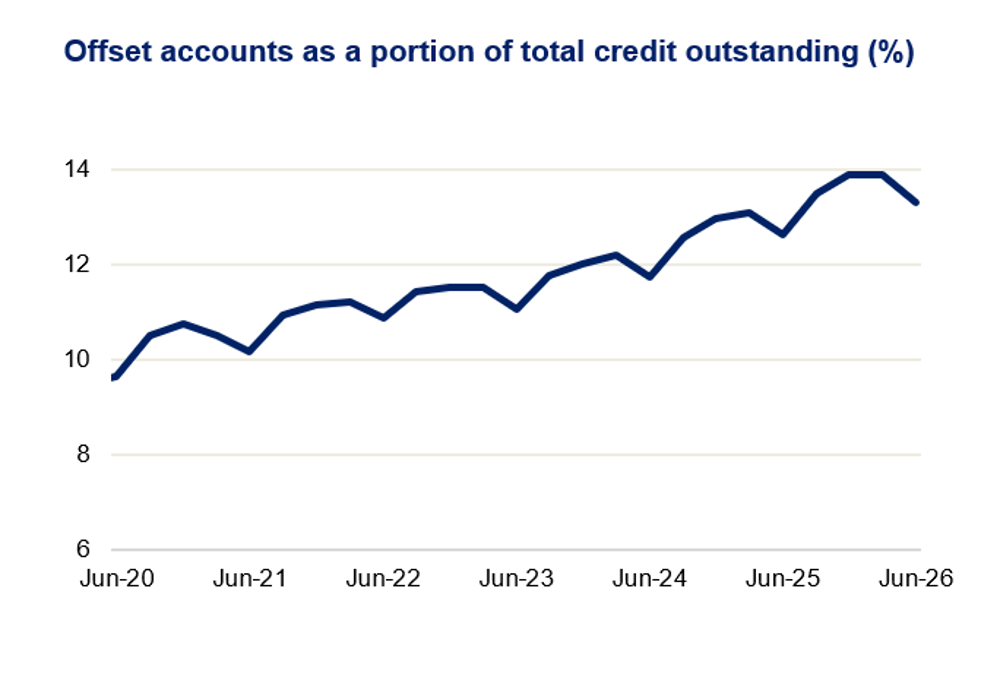
Residential mortgages: outstanding credit
Commercial real estate