
Quarterly authorised deposit-taking institution property exposure statistics - September 2025 highlights

Banking

Key statistics

Key residential mortgage lending statistics for ADIs for the quarter were:1

ADIs' residential property exposuresSep 2024Sep 2025Year-on-year change
Total credit outstanding ($bn)2,288.52,426.56.0%
Owner-occupied loans - share67.7%67.3%-0.43 points
Investment loans - share30.4%30.7%0.37 points
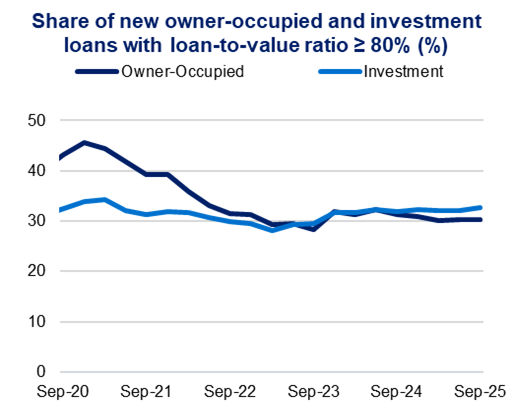
Loans with loan-to-valuation ratio (LVR) ≥ 80 per cent - share17.4%16.8%-0.6 points
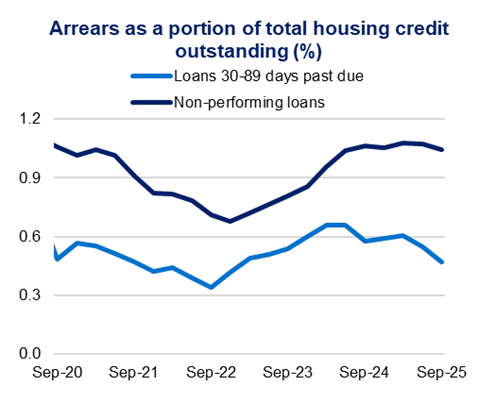
Loans 30-89 days past due - share0.58%0.47%-0.11 points
Non-performing loans0.96%1.04%0.08 points
ADIs’ new loans funded during the quarterSep 2024Sep 2025Year-on-year change
New loans funded ($bn)165.0196.318.9%
New owner-occupied loans funded - share62.8%61.1%-1.65 points
New investment loans funded - share35.1%36.5%1.47 points
New loans with LVR ≥ 80 per cent funded - share31.1%30.8%-0.25 points
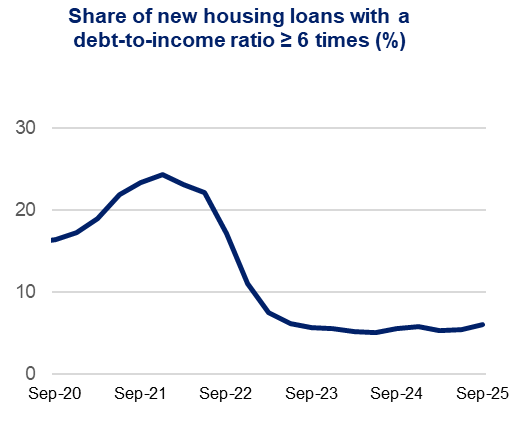
New loans with debt-to-income (DTI) ratio ≥ 6x funded - share5.6%6.1%0.5 points

Key commercial property statistics for ADIs for the quarter were:

ADIs' commercial property exposuresSep 2024Sep 2025Year-on-year change
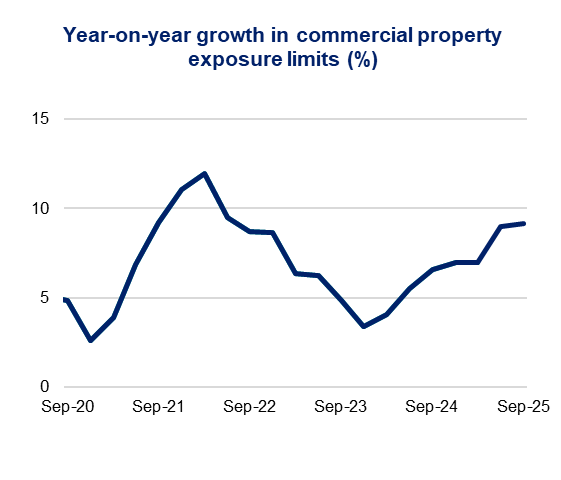
Commercial property exposure limits ($bn)467.5510.39.2%
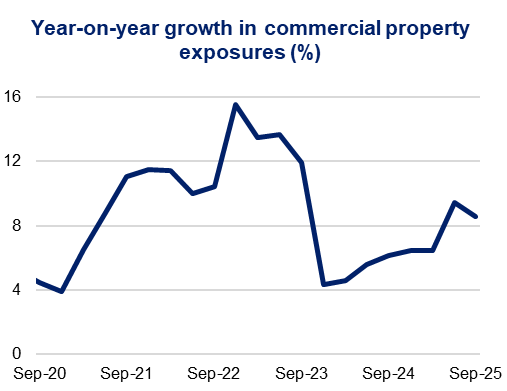
Commercial property exposures ($bn)434.6471.88.6%

Residential mortgages: new lending
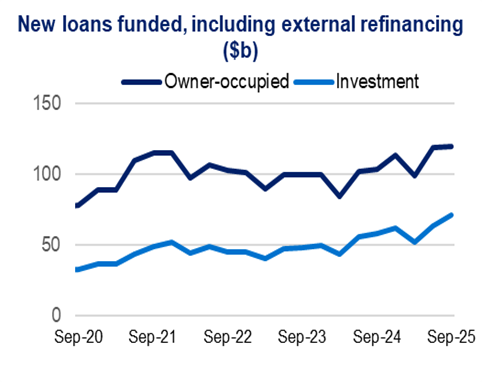
Line graph showing new loans funded from Sep 2020 to Sep 2025. Owner-occupied loans (dark blue) and investment loans (light blue) generally trend upward.
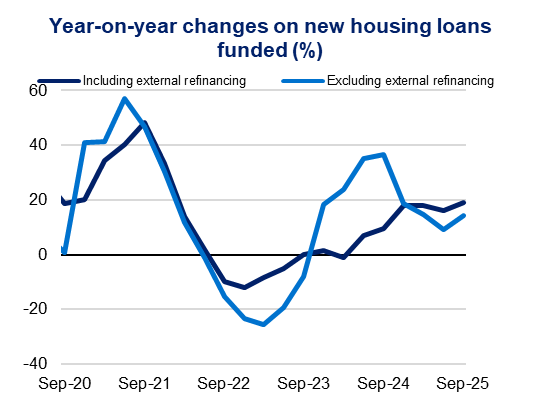
Line graph of year-on-year changes in new housing loans funded from Sep-20 to Sep-25. Dark blue shows loans including external refinancing; light blue excludes it. Peaks near Sep-21 for both, then dip, rising again near Sep-24.
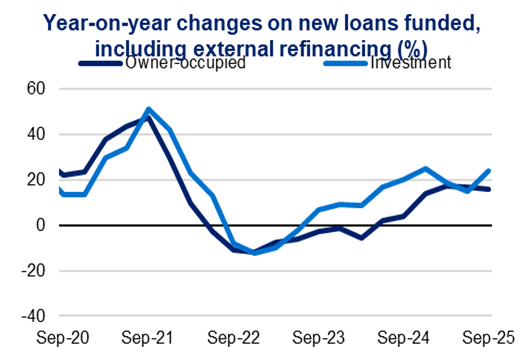
Line graph showing year-on-year changes in loans funded, including refinancing, from Sep-20 to Sep-25. Owner-occupied loans peak in Sep-21, then decline, while investment loans show similar trends but less fluctuation.
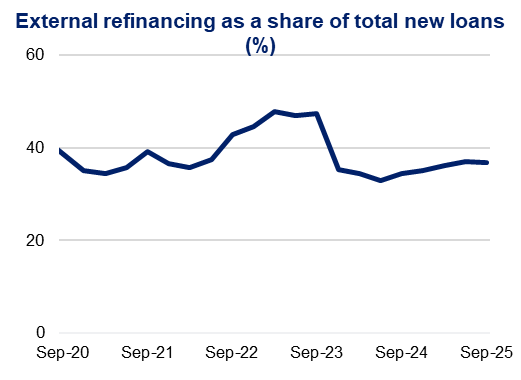
Line graph titled "External refinancing as a share of total new loans (%)" from Sep-20 to Sep-25. Peaks around Sep-22, dips after Sep-23 at 40%.
Line graph titled "Share of new housing loans with a debt-to-income ratio ≥ 6 times (%)" from Sep-20 to Sep-25. Peaks near 25% in Sep-21, dips below 10% by Sep-23.
Line graph showing the share of new loans with a loan-to-value ratio of 80% or more from Sep 2020 to Sep 2025. Owner-occupied loans start at around 40% and decrease slightly, while investment loans remain lower and relatively stable.
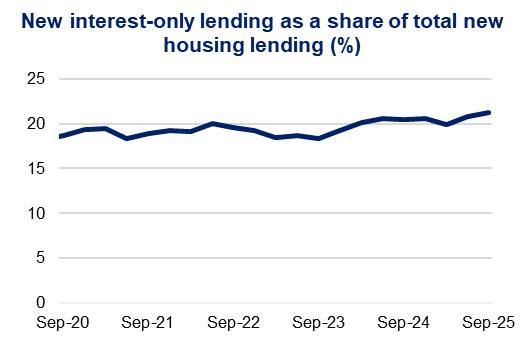
Line chart titled "New interest-only lending as a share of total new housing lending (%)" shows a slight upward trend from 20% in Sep 2020 to Sep 2025.
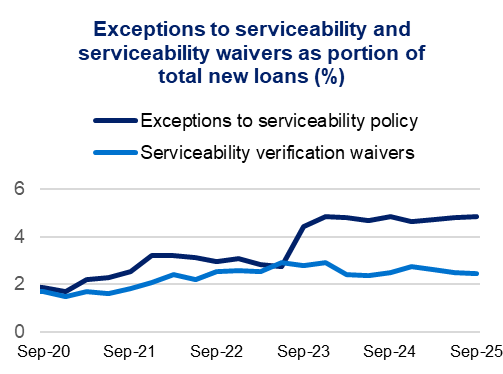
Line graph depicting exceptions to serviceability and waivers as a percentage of new loans from Sep-20 to Sep-25. Exceptions rise sharply in Sep-23.

Residential mortgages: outstanding credit
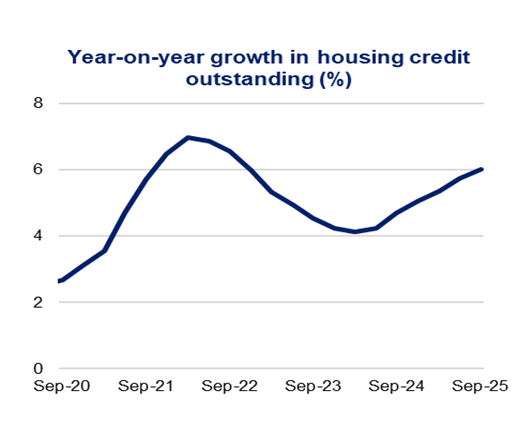
Line graph showing year-on-year growth in housing credit outstanding from 2020 to 2025. Peaks near 7% in 2021, dips to 4% by 2023, then rises to 6%.
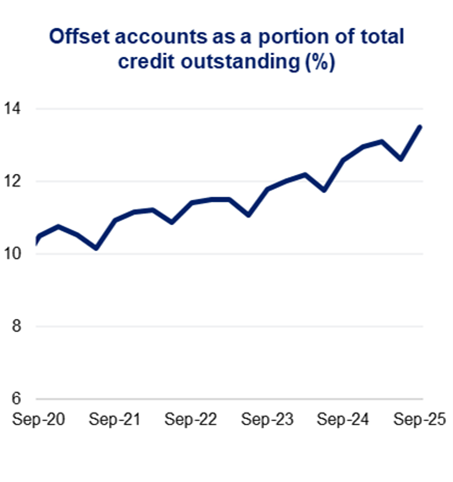
Line chart titled "Offset accounts as a portion of total credit outstanding (%)" from September 2020 to September 2025, showing a steady increase from 10% to 14%.
Line graph showing arrears as a portion of total housing credit from Sep 2020 to Sep 2025. Two lines depict loans 30-89 days past due and non-performing loans.
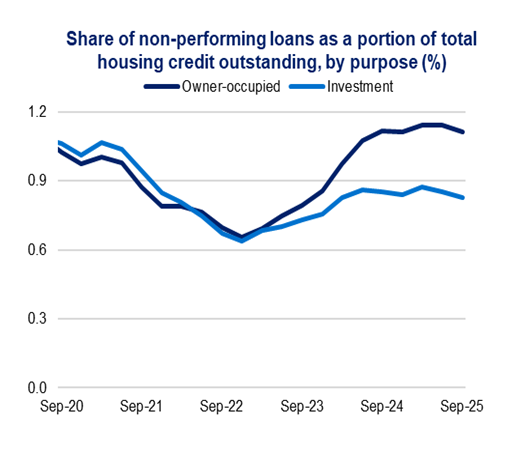
Chart showing trends in non-performing loans from Sep 2020 to Sep 2025. Investment loans decrease then rise. Owner-occupied loans follow a similar pattern
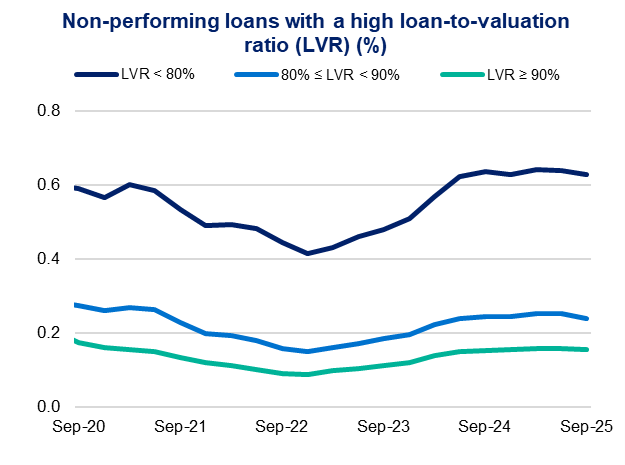
"Line graph depicting non-performing loans with high loan-to-valuation ratios (LVR) from Sep 2020 to Sep 2025. The dark blue line shows LVR < 80%, decreasing initially, then rising to 0.6%. The light blue line (80% ≤ LVR < 90%) and green line (LVR ≥ 90%) are stable around 0.2% and 0.1%, respectively.

Commercial real estate

Line graph of year-on-year growth in commercial property exposure limits from Sep-20 to Sep-25. Peaks at Sep-21, declines to Sep-23, and rises again.
Line graph showing year-on-year growth in commercial property exposures from Sep 2020 to Sep 2025. Peaks at 15% in early 2022, dips to 3% mid-2024.
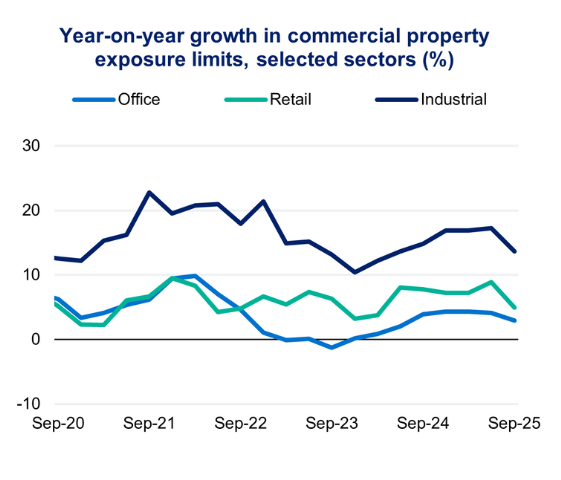
Line graph showing year-on-year growth in commercial property limits for Office, Retail, and Industrial sectors from Sep 2020 to Sep 2025.
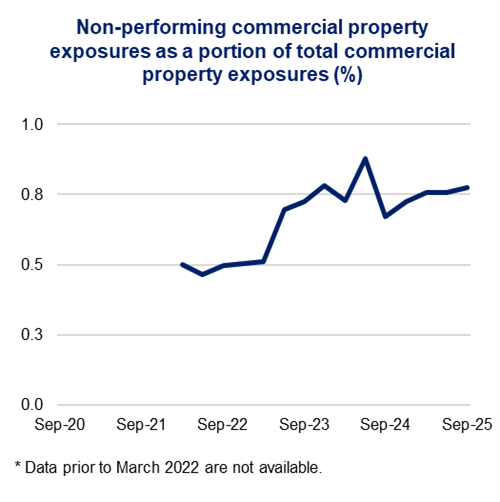
Line graph showing non-performing commercial property exposures as a percentage of total exposures, rising from 2022, peaking in 2024, then stabilising.

Footnotes

  • 1

    Excludes ADIs that are not banks, building societies or credit unions. See ‘Explanatory Notes’ of the Quarterly authorised deposit-taking institution property exposures statistics (excel file) for details of share calculations.

The Australian Prudential Regulation Authority (APRA) is the prudential regulator of the financial services industry. It oversees banks, mutuals, general insurance and reinsurance companies, life insurance, private health insurers, friendly societies, and most members of the superannuation industry. APRA currently supervises institutions holding around $10.6 trillion in assets for Australian depositors, policyholders and superannuation fund members.