
Statistical Publication

Temporary loan repayment deferrals due to COVID-19

Banking
Published
30 November 2021

2020

Many authorised deposit-taking institutions (ADIs) have granted temporary relief to borrowers impacted by COVID-19, allowing them to defer loan repayments for a period of time. To provide greater transparency of loan repayment deferrals at the industry level, APRA is publishing the aggregated data obtained from Australia's 20 largest ADIs. 
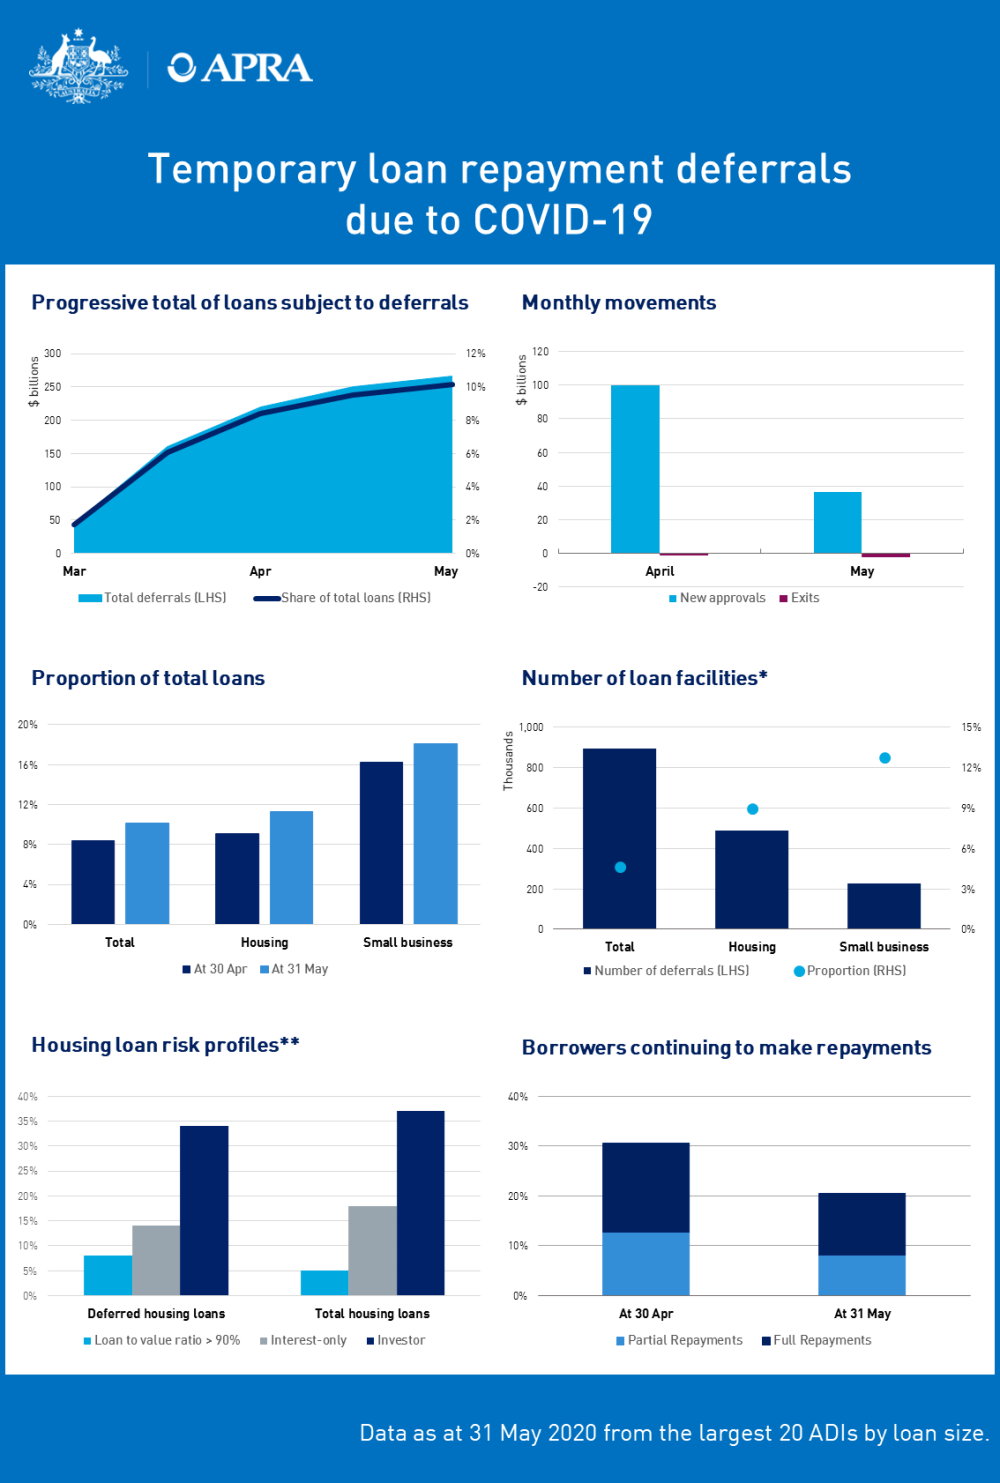
Temporary loan repayment deferrals due to COVID-19

*the number of facilities does not necessarily indicate the number of borrowers as individual facilities with more than one repayment type may be reported more than once.

**to give an indicator of potential elevated risk in loans subject to deferral this chart compares loans subject to deferral to total loans across three key cohorts - loan to value ratio of greater than 90 per cent, investor loans and interest only loans. 

An accessible version of the dashboard, with data labels, is available here.

Additional commentary

 Deferred loansTotal loansDeferred loans, share of total loans
Total$266 billion$2.6 trillion10%
Housing$192 billion$1.7 trillion11%
Small business$56 billion$311 billion18%

As at 31 May, data submitted by the 20 largest ADIs indicates that $266 billion worth of loans have been granted temporary repayment deferrals, which is close to 10 per cent of total loans outstanding. Housing loans make up the majority of total loans granted repayment deferrals, although small business loans have a higher incidence of repayment deferral with 18 per cent of small business loans subject to repayment deferral, compared with 11 per cent of housing loans. 

The rate of increase in loans now subject to repayment deferrals between April and May has slowed as applications reduced in May and some ADIs continue to work through processing high volumes of applications received in April. The pace at which loans become subject to repayment deferrals will be dependent upon a number of factors. The reduction from April to May does not necessarily indicate a trend.

The temporary repayment deferral programs were implemented within tight timeframes and the data has been submitted to APRA on a best endeavours basis. As ADIs improve their ability to capture these data items, resubmissions are expected. APRA will continue to publish this aggregate information on a monthly basis until loans subject to repayment deferrals are no longer a notable component of the ADI industry’s total loan portfolio.
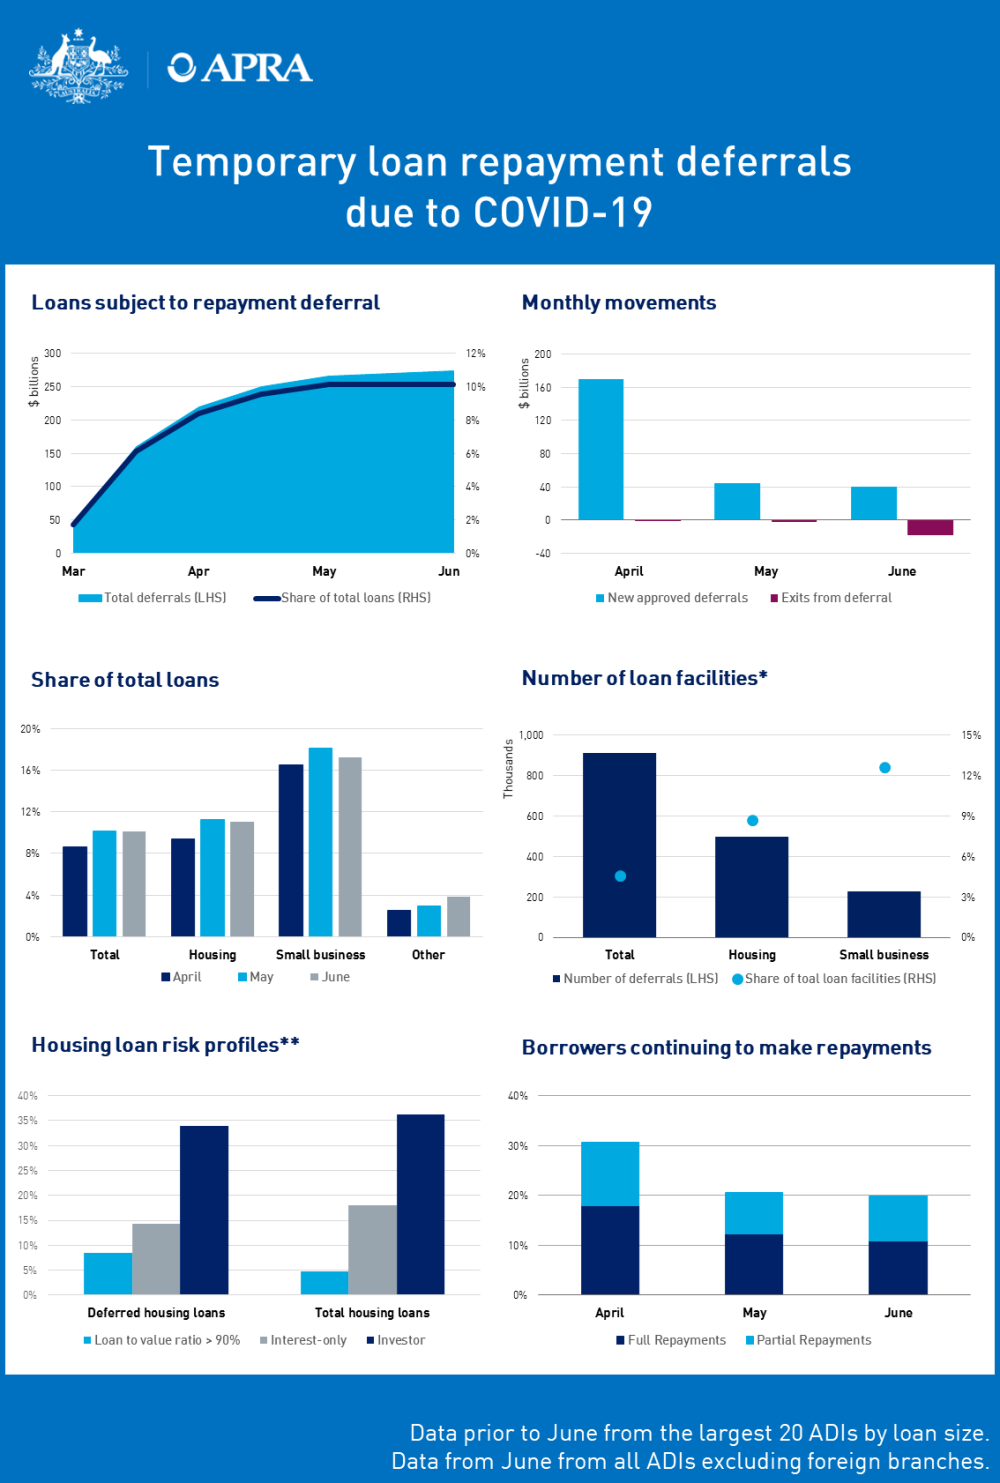
Many authorised deposit-taking institutions (ADIs) have granted temporary relief to borrowers impacted by COVID-19, allowing them to defer loan repayments for a period of time. To provide greater transparency of loan repayment deferrals at the industry level, APRA is publishing the aggregated data obtained from all ADIs in Australia, excluding foreign branches. 

An accessible version of the dashboard is available at https://www.apra.gov.au/temporary-loan-repayment-deferrals-due-to-covid-19-june-2020-accessible-version

*the number of facilities does not necessarily indicate the number of borrowers as individual facilities with more than one repayment type may be reported more than once.
**to give an indicator of potential elevated risk in loans subject to deferral this chart compares loans subject to deferral to total loans across three key cohorts - loan to value ratio of greater than 90 per cent, investor loans and interest only loans. 

An accessible version of the dashboard, with data labels, is available here.

Additional commentary

 Deferred loansTotal loansDeferred loans, share of total loans
Total$274 billion$2.7 trillion10%
Housing$195 billion$1.8 trillion11%
Small business$55 billion$321 billion17%

As at 30 June, data submitted by all ADIs indicates that $274 billion worth of loans have been granted temporary repayment deferrals, which is close to 10 per cent of total loans outstanding. Housing loans make up the majority of total loans granted repayment deferrals, although small business loans have a higher incidence of repayment deferral with 17 per cent of small business loans subject to repayment deferral, compared with 11 per cent of housing loans. 

Overall the composition of loan repayment deferrals remains relatively stable with the most noticeable change being increased loans exiting from repayment deferral, from $2 billion in May to $18 billion in June. The majority of these loans have returned to a performing status. The housing risk profile shows that housing loans granted repayment deferrals are more likely to be extended to owner-occupier borrowers, subject to principal and interest repayments, and have higher loan to value ratios than all housing loans. 

The temporary repayment deferral programs were implemented within tight timeframes and the data has been submitted to APRA on a best endeavours basis. As ADIs improve their ability to capture these data items, resubmissions are expected. APRA will continue to publish this aggregate information on a monthly basis until loans subject to repayment deferrals are no longer a notable component of the ADI industry’s total loan portfolio.
Many authorised deposit-taking institutions (ADIs) have granted temporary relief to borrowers impacted by COVID-19, allowing them to defer loan repayments for a period of time. To provide greater transparency of loan repayment deferrals, APRA is publishing:

  • the aggregated data obtained from all ADIs in Australia, excluding foreign branches; and
  • data from ADIs with loans subject to repayment deferrals.

Aggregate industry data on loans subject to repayment deferrals

Aggregate industry level data on loans subject to repayment deferrals - July 2020

*the number of facilities does not necessarily indicate the number of borrowers as individual facilities with more than one repayment type may be reported more than once.

**to give an indicator of potential elevated risk in loans subject to deferral this chart compares loans subject to deferral to total loans across three key cohorts – loan to value ratio of greater than 90 per cent, investor loans and interest only loans. 

View an accessible version of this dashboard.

Additional commentary

 Deferred loansTotal loansDeferred loans, share of total loans
Total$240 billion$2.7 trillion9%
Housing$167 billion$1.8 trillion9%
Small business$55 billion$319 billion17%

As at 31 July, data submitted by all ADIs indicates that $240 billion worth of loans have been granted temporary repayment deferrals, which is close to 9 per cent of total loans outstanding. Housing loans make up the majority of total loans granted repayment deferrals, although small business loans have a higher incidence of repayment deferral with 17 per cent of small business loans subject to repayment deferral, compared with 9 per cent of housing loans.

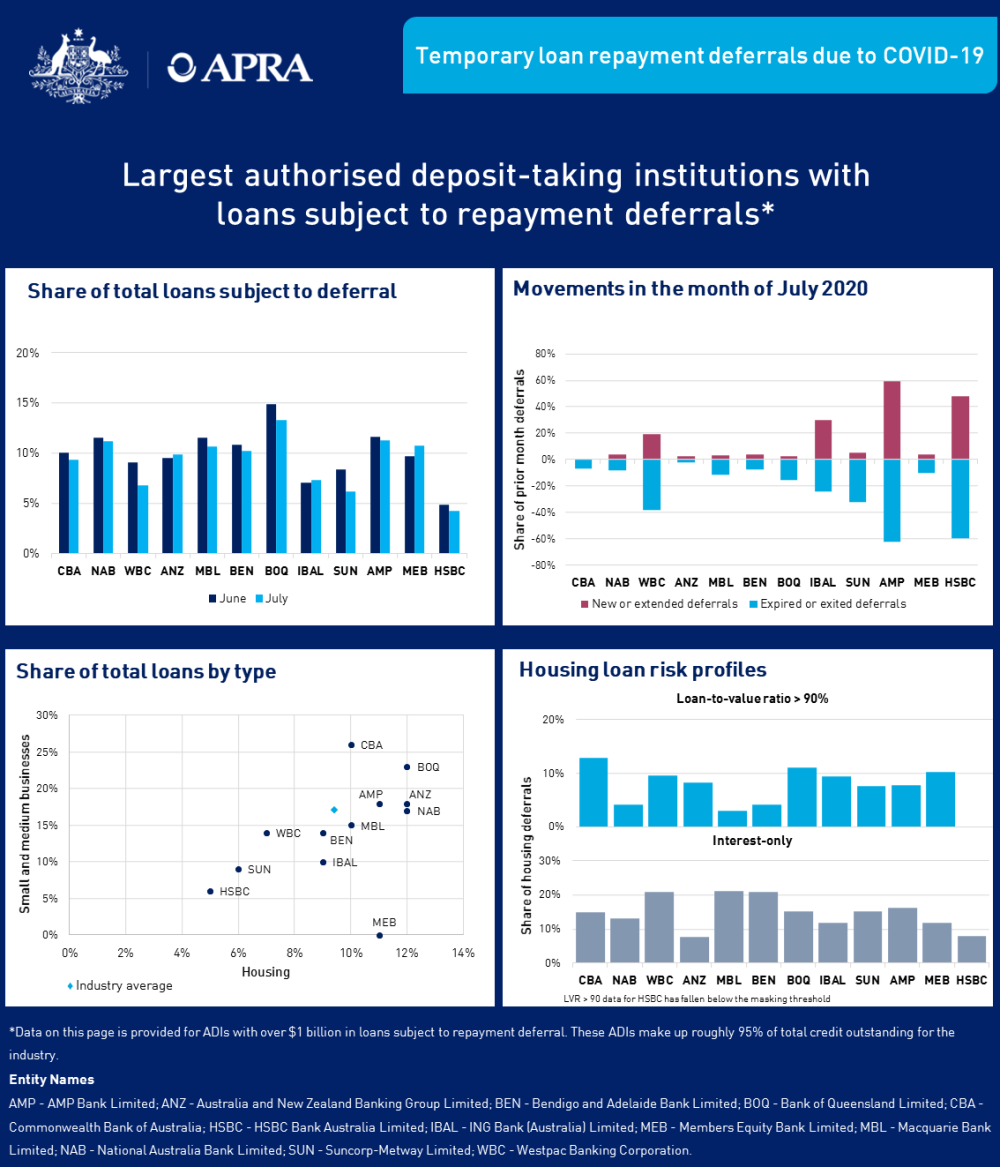
Loans that exited or expired outweighed new or extended loans for the first time in July, with exited or expired loans increasing from $33 billion in June to $40 billion in July.

Largest ADIs with loans subject to repayment deferrals

Largest authorised deposit-taking institutions with loans subject to repayment deferrals - July 2020

View an accessible version of this dashboard.

Explanatory notes

This data is sourced from the domestic loan portfolios1 of APRA-regulated authorised deposit-taking institutions (ADIs), excluding foreign branches. The spreadsheet below contains data for all ADIs with total loans subject to temporary repayment deferral of greater than $20 million and more than 20 deferred facilities in any given reporting period. In addition, for privacy reasons, fields are masked where there is a non-zero value below $10 million or there are less than 20 facilities. For an entity where either the "new or extended in the month" field or the "expired or exited in the month" field falls below this threshold, both of these fields are masked.

Changes in total loans subject temporary repayment deferral occur due to several factors. These factors include (but are not limited to) new deferrals, exits from deferral, addition of interest charges on existing deferrals and customers paying down their loans subject to deferral. Note that the graphs displaying “movements” (top right on both dashboards above) only include exits, new or extended deferrals but do not include other factors that change the value of total loans subject to temporary repayment deferral. Also note that, when a borrower’s loan repayment deferral is extended it is reported in this data as both "expired or exited in the month" (as the initial deferral has expired) and "new or extended in the month" (as it has been extended). 

All data has been submitted to APRA on a best endeavours basis under relatively tight timeframes. As a result, data may be revised in future reports.

APRA will continue to publish this information on a monthly basis until loans subject to repayment deferrals are no longer a notable component of the ADI industry’s total loan portfolio.
Footnote

  1. Domestic loan portfolio refers to loans provided within Australia on the balance sheet of the licenced ADI.

Glossary

ADI refers to an authorised deposit-taking institution, meaning a body corporate authorised under section 9 of the Banking Act 1959, to carry on banking business in Australia (e.g. a bank, building society or credit union).

Expiring or exiting repayment deferral refers to the credit outstanding of loans that were no longer subject to repayment deferral or were extended beyond their original deferral terms.

Facility refers to one or more accounts/lending agreements that are for the same borrower(s), and are approved at the same point in time and/or as part of the same application for the same purpose class (and property purpose if housing), and differ only by characteristics relating to interest rate type (fixed interest rate or variable interest rate) and/or repayment type (interest-only or amortising). The number of facilities does not necessarily indicate the number of borrowers as individual facilities with more than one repayment type may be reported more than once.

Housing loans are loans to resident households for the purpose of housing.

Interest-only loans are loans on which only interest is paid during a set period and no principal is automatically amortised. These loans will typically revert to principal-and-interest repayments at the end of the interest-only period.

Investment loans are loans for the purpose of housing, where the funds are used for a residential property that is not owner-occupied. This refers to the occupation status of the residential property that has been obtained, not the occupation status of the property used as security. It includes holiday or vacation homes and part-time residences that are not the borrower’s principal place of residence.

Loan-to-value ratio (LVR) is the ratio of the outstanding amount of the loan to the value of the property that secures the exposure.

Loans refers to loans and finance leases gross of provisions. Loans are financial assets that are created when a creditor lends funds directly to a debtor, and is evidenced by non-negotiable documents. Finance leases are leases that transfer substantially all the risks and rewards incidental to the ownership of an asset.

Loans subject to repayment deferral refers to the credit outstanding of loans where ADIs have granted temporary relief to borrowers impacted by the economic effects of COVID-19, allowing them to defer loan repayments for a set period of time.

New or extended loan deferrals refers to the credit outstanding of repayment deferrals that have been approved or extended.

Small and medium business loans refers to loans to small and medium enterprises with less than $10 million in total debt facilities outstanding.

Many authorised deposit-taking institutions (ADIs) have granted temporary relief to borrowers impacted by COVID-19, allowing them to defer loan repayments for a period of time. To provide greater transparency of loan repayment deferrals, APRA is publishing:

  • the aggregated data obtained from all ADIs in Australia, excluding foreign branches; and
  • data from ADIs with loans subject to repayment deferral.

Aggregate industry data on loans subject to repayment deferral

https://www.apra.gov.au/temporary-loan-repayment-deferrals-due-to-covid-19-august-2020-accessible-version

 *the number of facilities does not necessarily indicate the number of borrowers as individual facilities with more than one repayment type may be reported more than once.

**to give an indicator of potential elevated risk in loans subject to deferral this chart compares loans subject to deferral to total loans across three key cohorts – loan to value ratio of greater than 90 per cent, investor loans and interest only loans. 

An accessible version of this dashboard is available here.

Additional commentary

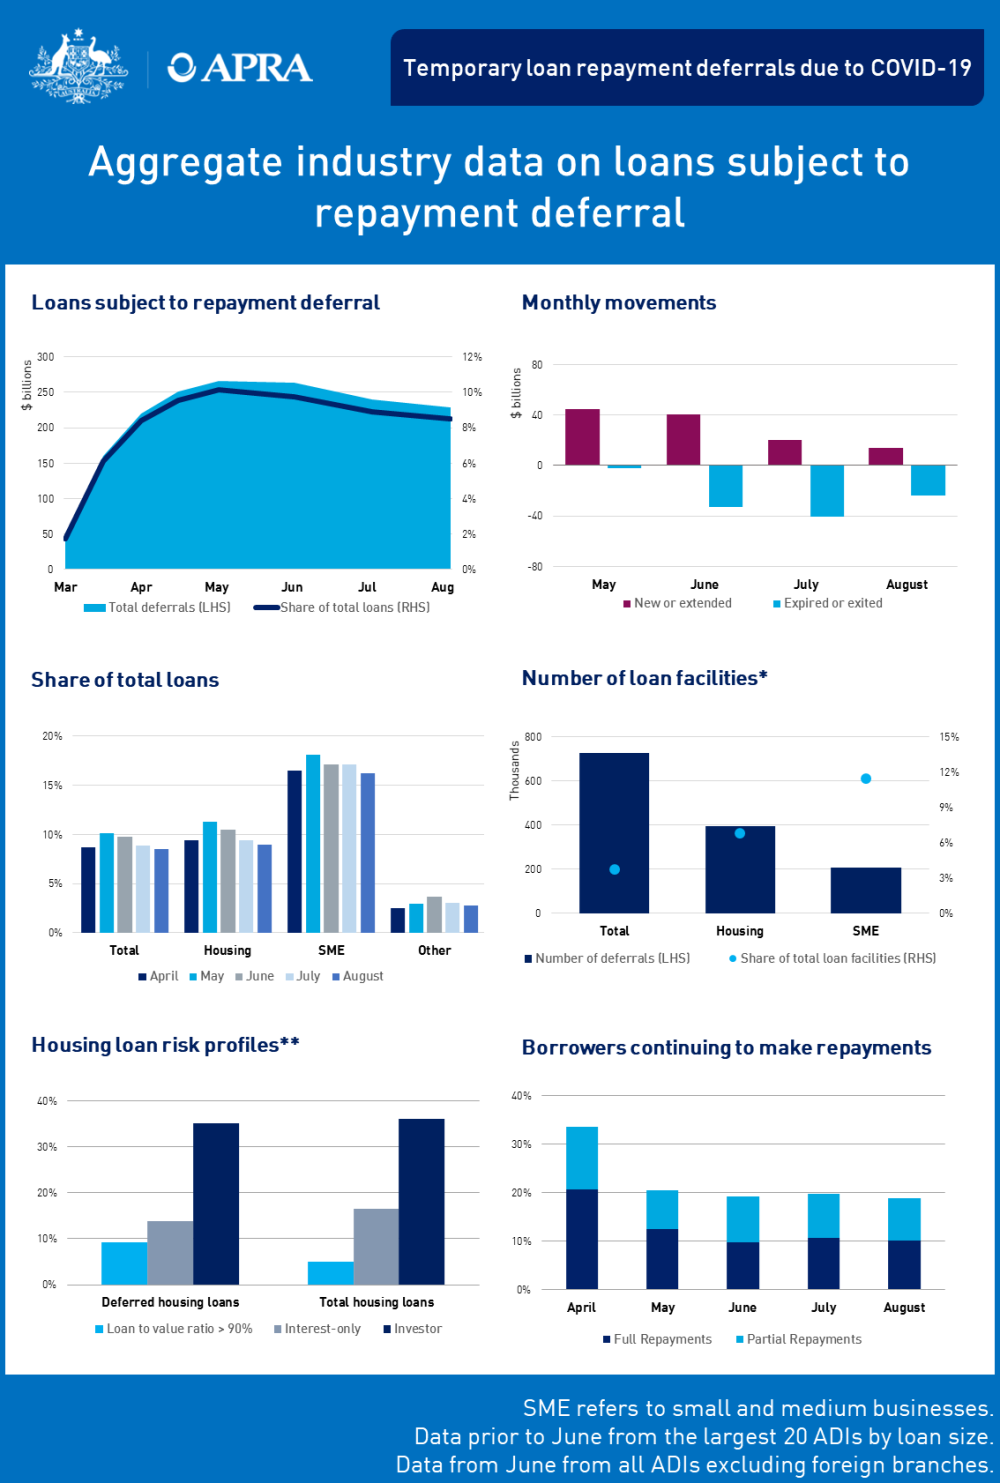
 Deferred loansTotal loansDeferred loans, share of total loans
Total$229 billion$2.7 trillion8.5%
Housing$160 billion$1.8 trillion9.0%
SME$53 billion$325 billion16.2%

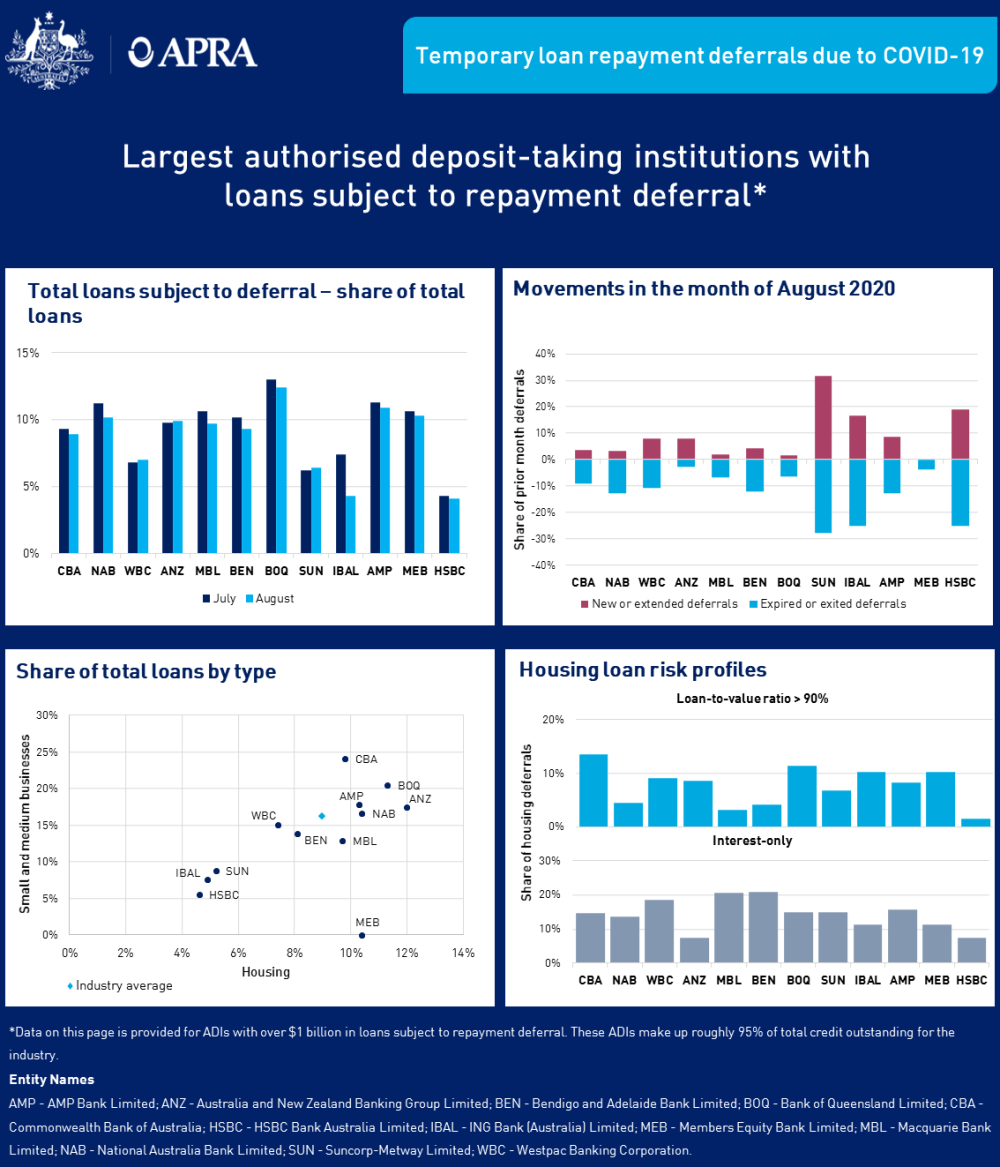
As at 31 August, data submitted by all ADIs indicates that $229 billion worth of loans have been granted temporary repayment deferrals, which is around 8.5 per cent of total loans outstanding. Housing loans make up the majority of total loans granted repayment deferrals, although small business loans have a higher incidence of repayment deferral with 16.2 per cent of small business loans subject to repayment deferral, compared with 9.0 per cent of housing loans.
 
Exits from deferral continue to outweigh new entries for the second straight month in August, with $24 billion loans expiring or exiting deferral and $14 billion of entries approved or extended. The pace of exits slowed over the month, with total exits decreasing 41 per cent from $40 billion in July. The majority of these loans have returned to a performing status. 

Largest ADIs with loans subject to repayment deferral

An accessible version of the dashboard is available at https://www.apra.gov.au/temporary-loan-repayment-deferrals-due-to-covid-19-august-2020-accessible-version

An accessible version of the dashboard is available here.

Explanatory notes

This data is sourced from the domestic loan portfolios1 of APRA-regulated authorised deposit-taking institutions (ADIs), excluding foreign branches. The spreadsheet below contains data for all ADIs with total loans subject to temporary repayment deferral of greater than $20 million and more than 20 deferred facilities in any given reporting period. In addition, for privacy reasons, fields are masked where there is a non-zero value below $10 million or there are less than 20 facilities. For an entity where either the "new or extended in the month" field or the "expired or exited in the month" field falls below this threshold, both of these fields are masked.

Changes in total loans subject temporary repayment deferral occur due to several factors. These factors include (but are not limited to) new deferrals, exits from deferral, addition of interest charges on existing deferrals and customers paying down their loans subject to deferral. Note that the graphs displaying “movements” (top right on both dashboards above) only include exits, new or extended deferrals but do not include other factors that change the value of total loans subject to temporary repayment deferral. Also note that, when a borrower’s loan repayment deferral is extended it is reported in this data as both "expired or exited in the month" (as the initial deferral has expired) and "new or extended in the month" (as it has been extended). 

All data has been submitted to APRA on a best endeavours basis under relatively tight timeframes. As a result, data may be revised in future reports.

APRA will continue to publish this information on a monthly basis until loans subject to repayment deferrals are no longer a notable component of the ADI industry’s total loan portfolio.
Footnote

  1. Domestic loan portfolio refers to loans provided within Australia on the balance sheet of the licenced ADI.

Glossary

ADI refers to an authorised deposit-taking institution, meaning a body corporate authorised under section 9 of the Banking Act 1959, to carry on banking business in Australia (e.g. a bank, building society or credit union).

Expiring or exiting repayment deferral refers to the credit outstanding of loans that were no longer subject to repayment deferral or were extended beyond their original deferral terms.

Facility refers to one or more accounts/lending agreements that are for the same borrower(s), and are approved at the same point in time and/or as part of the same application for the same purpose class (and property purpose if housing), and differ only by characteristics relating to interest rate type (fixed interest rate or variable interest rate) and/or repayment type (interest-only or amortising). The number of facilities does not necessarily indicate the number of borrowers as individual facilities with more than one repayment type may be reported more than once.

Housing loans are loans to resident households for the purpose of housing.

Interest-only loans are loans on which only interest is paid during a set period and no principal is automatically amortised. These loans will typically revert to principal-and-interest repayments at the end of the interest-only period.

Investment loans are loans for the purpose of housing, where the funds are used for a residential property that is not owner-occupied. This refers to the occupation status of the residential property that has been obtained, not the occupation status of the property used as security. It includes holiday or vacation homes and part-time residences that are not the borrower’s principal place of residence.

Loan-to-value ratio (LVR) is the ratio of the outstanding amount of the loan to the value of the property that secures the exposure.

Loans refers to loans and finance leases gross of provisions. Loans are financial assets that are created when a creditor lends funds directly to a debtor, and is evidenced by non-negotiable documents. Finance leases are leases that transfer substantially all the risks and rewards incidental to the ownership of an asset.

Loans subject to repayment deferral refers to the credit outstanding of loans where ADIs have granted temporary relief to borrowers impacted by the economic effects of COVID-19, allowing them to defer loan repayments for a set period of time.

New or extended loan deferrals refers to the credit outstanding of repayment deferrals that have been approved or extended.

Small and medium business (SME) loans refers to loans to small and medium enterprises with less than $10 million in total debt facilities outstanding.

Many authorised deposit-taking institutions (ADIs) have granted temporary relief to borrowers impacted by COVID-19, allowing them to defer loan repayments for a period of time. To provide greater transparency of loan repayment deferrals, APRA is publishing:

  • the aggregated data obtained from all ADIs in Australia, excluding foreign branches; and
  • data from ADIs with loans subject to repayment deferral.

Aggregate industry data on loans subject to repayment deferral

An accessible version of this dashboard is available at https://www.apra.gov.au/temporary-loan-repayment-deferrals-due-to-covid-19-september-2020

* the number of facilities does not necessarily indicate the number of borrowers as individual facilities with more than one repayment type may be reported more than once.

** to give an indicator of potential elevated risk in loans subject to deferral this chart compares loans subject to deferral to total loans across three key cohorts – loan to value ratio of greater than 90 per cent, investor loans and interest only loans. 

An accessible version of this dashboard is available here. 

Additional commentary

 Deferred loansTotal loansDeferred loans, share of total loans
Total$179 billion$2.7 trillion6.7%
Housing$133 billion$1.8 trillion7.4%
SME$35 billion$326 billion10.8%

As at 30 September, data submitted by all ADIs indicates that $179 billion worth of loans have been granted temporary repayment deferrals, which is around 6.7 per cent of total loans outstanding. Housing loans make up the majority of total loans granted repayment deferrals, although SME loans have a higher incidence of repayment deferral with 10.8 per cent of SME loans subject to repayment deferral, compared with 7.4 per cent of housing loans.
 
Exits from deferral continued to outweigh new entries for the third straight month in September, with $66 billion loans expiring or exiting deferral and $17 billion of entries approved or extended. Pace of exits increased significantly over the month, with total exits increasing 169 per cent from $24 billion in August. The majority of these loans have returned to a performing status. 

Largest ADIs with loans subject to repayment deferral

An accessible version of the dashboard is available at https://www.apra.gov.au/temporary-loan-repayment-deferrals-due-to-covid-19-september-2020-accessible-version

An accessible version of this dashboard is available here.

Explanatory notes

This data is sourced from the domestic loan portfolios1 of APRA-regulated authorised deposit-taking institutions (ADIs), excluding foreign branches. The spreadsheet below contains data for all ADIs with total loans subject to temporary repayment deferral of greater than $20 million and more than 20 deferred facilities in any given reporting period. In addition, for privacy reasons, fields are masked where there is a non-zero value below $10 million or there are less than 20 facilities. For an entity where either the "new or extended in the month" field or the "expired or exited in the month" field falls below this threshold, both of these fields are masked.

Changes in total loans subject temporary repayment deferral occur due to several factors. These factors include (but are not limited to) new deferrals, exits from deferral, addition of interest charges on existing deferrals and customers paying down their loans subject to deferral. Note that the graphs displaying “movements” (top right on both dashboards above) only include exits, new or extended deferrals but do not include other factors that change the value of total loans subject to temporary repayment deferral. Also note that, when a borrower’s loan repayment deferral is extended it is reported in this data as both "expired or exited in the month" (as the initial deferral has expired) and "new or extended in the month" (as it has been extended). 

All data has been submitted to APRA on a best endeavours basis under relatively tight timeframes. As a result, data may be revised in future reports.

APRA will continue to publish this information on a monthly basis until loans subject to repayment deferrals are no longer a notable component of the ADI industry’s total loan portfolio.

Footnote

  1. Domestic loan portfolio refers to loans provided within Australia on the balance sheet of the licenced ADI.

Many authorised deposit-taking institutions (ADIs) have granted temporary relief to borrowers impacted by COVID-19, allowing them to defer loan repayments for a period of time. To provide greater transparency of loan repayment deferrals, APRA is publishing:

  • the aggregated data obtained from all ADIs in Australia, excluding foreign branches; and
  • data from ADIs with loans subject to repayment deferral.

Aggregate industry data on loans subject to repayment deferral

An accessible version of this dashboard is available at https://www.apra.gov.au/temporary-loan-repayment-deferrals-due-to-covid-19-october-2020-accessible-version

* the number of facilities does not necessarily indicate the number of borrowers as individual facilities with more than one repayment type may be reported more than once.

** to give an indicator of potential elevated risk in loans subject to deferral this chart compares loans subject to deferral to total loans across three key cohorts – loan to value ratio of greater than 90 per cent, investor loans and interest only loans. 

An accessible version of this dashboard is available here. 

Additional commentary

 Deferred loansTotal loansDeferred loans, share of total loans
Total$87.6 billion$2.7 trillion3.3%
Housing$68.2 billion$1.8 trillion3.9%
SME$14.3 billion$322.8 billion4.5%

As at 31 October, according to data submitted by ADIs with over $20 million in loans subject to repayment deferral, a total of $88 billion worth of loans are on temporary repayment deferrals, which is around 3.3 per cent of total loans outstanding. Housing loans make up the majority of total loans granted repayment deferrals, although SME loans have a higher incidence of repayment deferral with 4.5 per cent of SME loans subject to repayment deferral, compared to 3.9 per cent of housing loans.
 
Exits from deferral continued to outweigh new entries for the fourth straight month in October, with $100 billion in loans expiring or exiting deferral and $12 billion entering or being extended. The total value of loans subject to deferral more than halved over the month to October, with the pace of exits increasing significantly. 

Largest ADIs with loans subject to repayment deferral

An accessible version of this dashboard is available at https://www.apra.gov.au/temporary-loan-repayment-deferrals-due-to-covid-19-october-2020-accessible-version

An accessible version of this dashboard is available here. 

Explanatory notes

This data is sourced from the domestic loan portfolios1 of APRA-regulated authorised deposit-taking institutions (ADIs), excluding foreign branches. The spreadsheet below contains data for all ADIs with total loans subject to temporary repayment deferral of greater than $20 million and more than 20 deferred facilities in any given reporting period. In addition, for privacy reasons, fields are masked where there is a non-zero value below $10 million or there are less than 20 facilities. For an entity where either the "new or extended in the month" field or the "expired or exited in the month" field falls below this threshold, both of these fields are masked.

Changes in total loans subject temporary repayment deferral occur due to several factors. These factors include (but are not limited to) new deferrals, exits from deferral, addition of interest charges on existing deferrals and customers paying down their loans subject to deferral. Note that the graphs displaying “movements” (top right on both dashboards above) only include exits, new or extended deferrals but do not include other factors that change the value of total loans subject to temporary repayment deferral. Also note that, when a borrower’s loan repayment deferral is extended it is reported in this data as both "expired or exited in the month" (as the initial deferral has expired) and "new or extended in the month" (as it has been extended). 

All data has been submitted to APRA on a best endeavours basis under relatively tight timeframes. As a result, data may be revised in future reports.

APRA will continue to publish this information on a monthly basis until loans subject to repayment deferrals are no longer a notable component of the ADI industry’s total loan portfolio.

Footnote

  1. Domestic loan portfolio refers to loans provided within Australia on the balance sheet of the licenced ADI.

Next issue

The November 2020 issue will be released on 5 January 2021.

Many authorised deposit-taking institutions (ADIs) have granted temporary relief to borrowers impacted by COVID-19, allowing them to defer loan repayments for a period of time. To provide greater transparency of loan repayment deferrals, APRA is publishing:

  • the aggregated data obtained from all ADIs in Australia, excluding foreign branches; and
  • data from ADIs with loans subject to repayment deferral.

Aggregate industry data on loans subject to repayment deferral

An accessible version of this dashboard is available at https://www.apra.gov.au/temporary-loan-repayment-deferrals-due-to-covid-19-november-2020-accessible-version

* the number of facilities does not necessarily indicate the number of borrowers as individual facilities with more than one repayment type may be reported more than once.

** to give an indicator of potential elevated risk in loans subject to deferral this chart compares loans subject to deferral to total loans across three key cohorts – loan to value ratio of greater than 90 per cent, investor loans and interest only loans. 

An accessible version of this dashboard is available here. 

Additional commentary

 Deferred loansTotal loansDeferred loans, share of total loans
Total$60.3 billion$2.7 trillion2.3%
Housing$49.5 billion$1.8 trillion2.8%
SME$7.6 billion$322.3 billion2.4%

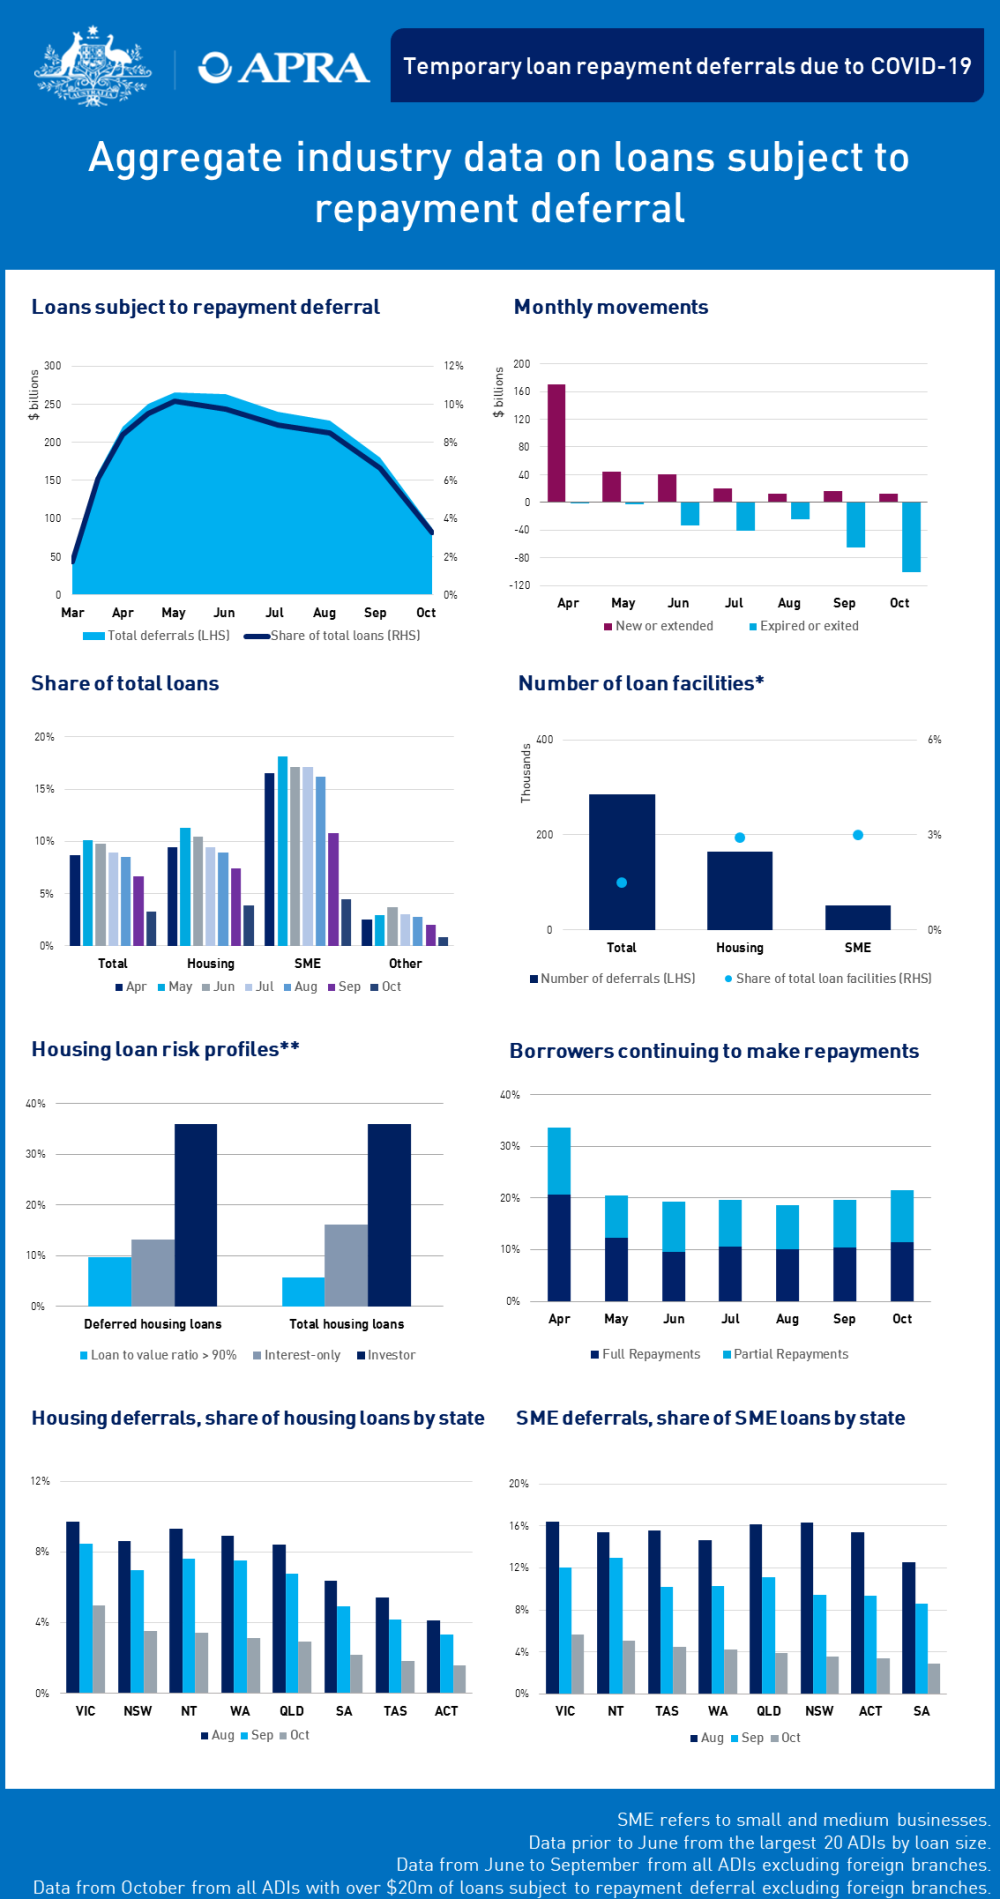
As at 30 November, according to data submitted by ADIs with over $20 million in loans subject to repayment deferral, a total of $60 billion worth of loans are on temporary repayment deferrals, which is around 2.3 per cent of total loans outstanding. Housing loans make up the majority of total loans granted repayment deferrals, and for the first time in November also have a higher incidence of repayment deferral with 2.4 per cent of SME loans subject to repayment deferral, compared to 2.8 per cent of housing loans.
 
Exits from deferral continued to outweigh new entries for the fifth straight month in November, with $32 billion in loans expiring or exiting deferral and $7 billion entering or being extended. Victoria remains the state with the highest proportion of loans subject to deferral amongst the states and territories, with 3.2 per cent of loans deferred compared with the rest of the country at 1.7 per cent.

Largest ADIs with loans subject to repayment deferral

An accessible version of this dashboard is available at https://www.apra.gov.au/temporary-loan-repayment-deferrals-due-to-covid-19-november-2020-accessible-version

An accessible version of this dashboard is available here. 

Explanatory notes

This data is sourced from the domestic loan portfolios1 of APRA-regulated authorised deposit-taking institutions (ADIs), excluding foreign branches. The spreadsheet below contains data for all ADIs with total loans subject to temporary repayment deferral of greater than $20 million and more than 20 deferred facilities in any given reporting period. In addition, for privacy reasons, fields are masked where there is a non-zero value below $10 million or there are less than 20 facilities. For an entity where either the "new or extended in the month" field or the "expired or exited in the month" field falls below this threshold, both of these fields are masked.

Changes in total loans subject temporary repayment deferral occur due to several factors. These factors include (but are not limited to) new deferrals, exits from deferral, addition of interest charges on existing deferrals and customers paying down their loans subject to deferral. Note that the graphs displaying “movements” (top right on both dashboards above) only include exits, new or extended deferrals but do not include other factors that change the value of total loans subject to temporary repayment deferral. Also note that, when a borrower’s loan repayment deferral is extended it is reported in this data as both "expired or exited in the month" (as the initial deferral has expired) and "new or extended in the month" (as it has been extended). 

All data has been submitted to APRA on a best endeavours basis under relatively tight timeframes. As a result, data may be revised in future reports.

APRA will continue to publish this information on a monthly basis until loans subject to repayment deferrals are no longer a notable component of the ADI industry’s total loan portfolio.
Footnote

  1. Domestic loan portfolio refers to loans provided within Australia on the balance sheet of the licenced ADI.

Next issue

The December 2020 issue will be released on 29 January 2021.

Many authorised deposit-taking institutions (ADIs) have granted temporary relief to borrowers impacted by COVID-19, allowing them to defer loan repayments for a period of time. To provide greater transparency of loan repayment deferrals, APRA is publishing:

  • the aggregated data obtained from all ADIs in Australia, excluding foreign branches; and 
     
  • data from ADIs with loans subject to repayment deferral.

Aggregate industry data on loans subject to repayment deferral

An accessible version of this dashboard is available at https://www.apra.gov.au/temporary-loan-repayment-deferrals-due-to-covid-19-december-2020-accessible-version

* the number of facilities does not necessarily indicate the number of borrowers as individual facilities with more than one repayment type may be reported more than once.

** to give an indicator of potential elevated risk in loans subject to deferral this chart compares loans subject to deferral to total loans across three key cohorts – loan to value ratio of greater than 90 per cent, investor loans and interest only loans. 

An accessible version of this dashboard is available here. 

Additional commentary

 Deferred loansTotal loansDeferred loans, share of total loans
Total$51.2 billion$2.7 trillion1.9%
Housing$42.9 billion$1.8 trillion2.4%
SME$6.0 billion$319.9 billion1.9%

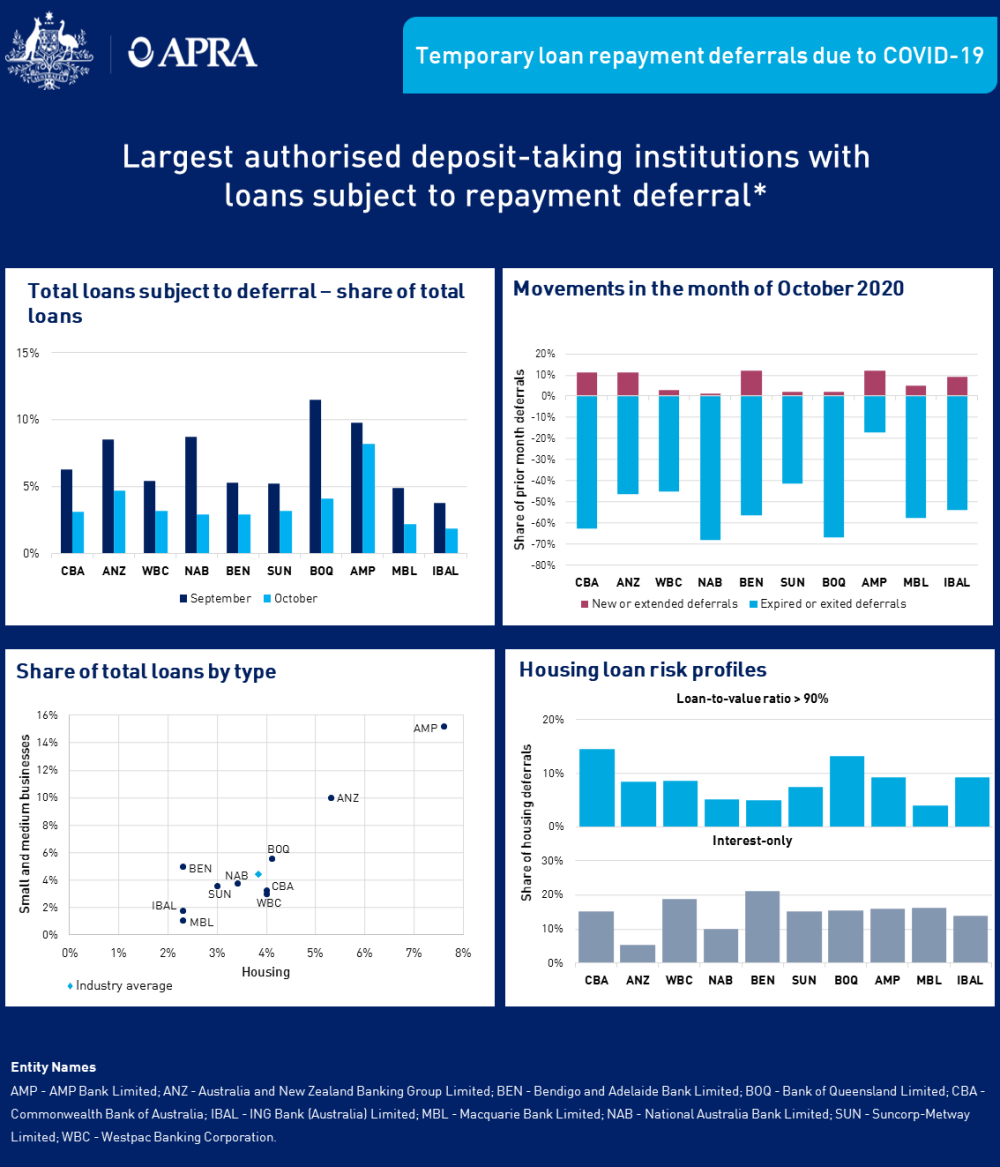
As at 31 December, according to data submitted by ADIs with over $20 million in loans subject to repayment deferral, a total of $51 billion worth of loans are on temporary repayment deferrals, which is around 1.9 per cent of total loans outstanding. 

Housing loans make up the majority of total loans granted repayment deferral and have a higher incidence of repayment deferral with 1.9 per cent of SME loans subject to repayment deferral, compared to 2.4 per cent of housing loans.

Exits from deferral continued to outweigh new entries for the sixth straight month in December, with $12 billion in loans expiring or exiting deferral and $3 billion entering or being extended. Victoria remains the state with the highest proportion of loans subject to deferral eligible for capital concession amongst the states and territories, with 2.8 per cent of loans deferred compared with the rest of the country at 1.4 per cent. 

Largest ADIs with loans subject to repayment deferral

An accessible version of this dashboard is available at https://www.apra.gov.au/temporary-loan-repayment-deferrals-due-to-covid-19-december-2020-accessible-version

An accessible version of this dashboard is available here. 

Explanatory notes

This data is sourced from the domestic loan portfolios1 of APRA-regulated authorised deposit-taking institutions (ADIs), excluding foreign branches. The spreadsheet below contains data for all ADIs with total loans subject to temporary repayment deferral of greater than $20 million and more than 20 deferred facilities in any given reporting period. In addition, for privacy reasons, fields are masked where there is a non-zero value below $10 million or there are less than 20 facilities. For an entity where either the "new or extended in the month" field or the "expired or exited in the month" field falls below this threshold, both of these fields are masked.

Changes in total loans subject temporary repayment deferral occur due to several factors. These factors include (but are not limited to) new deferrals, exits from deferral, addition of interest charges on existing deferrals and customers paying down their loans subject to deferral. Note that the graphs displaying “movements” (top right on both dashboards above) only include exits, new or extended deferrals but do not include other factors that change the value of total loans subject to temporary repayment deferral. Also note that, when a borrower’s loan repayment deferral is extended it is reported in this data as both "expired or exited in the month" (as the initial deferral has expired) and "new or extended in the month" (as it has been extended). 

All data has been submitted to APRA on a best endeavours basis under relatively tight timeframes. As a result, data may be revised in future reports.

APRA will continue to publish this information on a monthly basis until loans subject to repayment deferrals are no longer a notable component of the ADI industry’s total loan portfolio.
Footnote

  1. Domestic loan portfolio refers to loans provided within Australia on the balance sheet of the licenced ADI.

Next issue

The January 2021 issue will be released on 26 February 2021.

2021

Many authorised deposit-taking institutions (ADIs) have granted temporary relief to borrowers impacted by COVID-19, allowing them to defer loan repayments for a period of time. To provide greater transparency of loan repayment deferrals, APRA is publishing:

  • the aggregated data obtained from all ADIs in Australia, excluding foreign branches; and
  • data from ADIs with loans subject to repayment deferral.

Aggregate industry data on loans subject to repayment deferral

An accessible version of this dashboard is available at https://www.apra.gov.au/temporary-loan-repayment-deferrals-due-to-covid-19-january-2021-accessible-version

* the number of facilities does not necessarily indicate the number of borrowers as individual facilities with more than one repayment type may be reported more than once.

** to give an indicator of potential elevated risk in loans subject to deferral this chart compares loans subject to deferral to total loans across three key cohorts – loan to value ratio of greater than 90 per cent, investor loans and interest only loans. 

An accessible version of this dashboard is available here. 

Additional commentary

 Deferred loansTotal loansDeferred loans, share of total loans
Total$37.1 billion$2.6 trillion1.4%
Housing$32.0 billion$1.8 trillion1.8%
SME$3.6 billion$316.7 billion1.1%

As at 31 January, according to data submitted by ADIs with over $20 million in loans subject to repayment deferral, a total of $37 billion worth of loans are on temporary repayment deferrals, which is around 1.4 per cent of total loans outstanding, down from $50 billion (1.9 per cent of total loans outstanding) in December 2020. 

Housing loans make up the majority of total loans granted repayment deferral and have a higher incidence of deferral with 1.8 per cent of these loans subject to deferral, compared to 1.1 per cent of SME loans.

Exits from deferral continued to outweigh new entries for the seventh straight month in January, with $14 billion in loans expiring or exiting deferral and less than $1 billion entering or being extended. Victoria remains the state with the highest proportion of loans subject to deferral, at 2.0 per cent compared with the rest of the country at 1.0 per cent, though this difference is narrowing. 

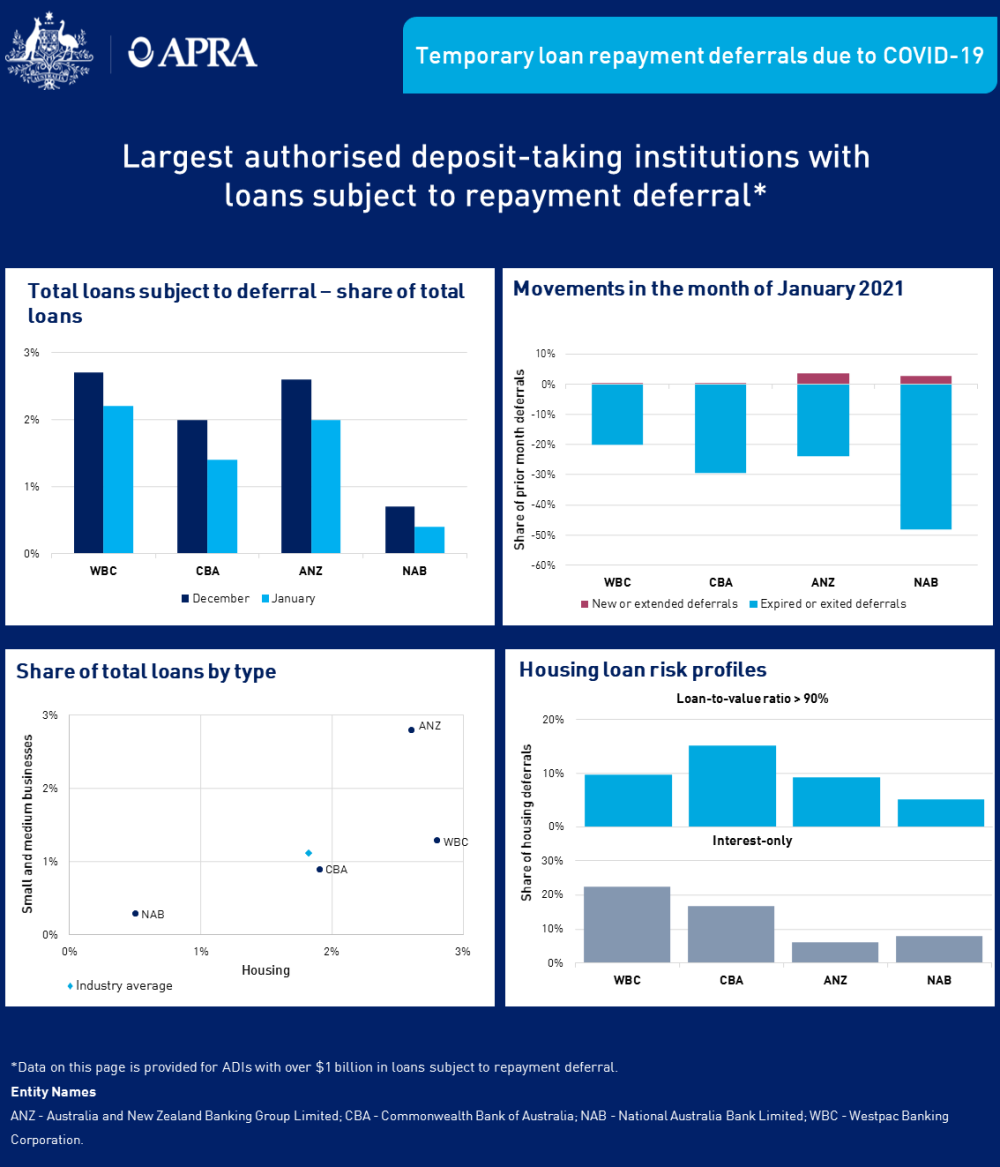
Largest ADIs with loans subject to repayment deferral

An accessible version of this dashboard is available at https://www.apra.gov.au/temporary-loan-repayment-deferrals-due-to-covid-19-january-2021-accessible-version

An accessible version of this dashboard is available here. 

Explanatory notes

This data is sourced from the domestic loan portfolios1 of APRA-regulated authorised deposit-taking institutions (ADIs), excluding foreign branches. The spreadsheet below contains data for all ADIs with total loans subject to temporary repayment deferral of greater than $20 million and more than 20 deferred facilities in any given reporting period. In addition, for privacy reasons, fields are masked where there is a non-zero value below $10 million or there are less than 20 facilities. For an entity where either the "new or extended in the month" field or the "expired or exited in the month" field falls below this threshold, both of these fields are masked.

Changes in total loans subject temporary repayment deferral occur due to several factors. These factors include (but are not limited to) new deferrals, exits from deferral, addition of interest charges on existing deferrals and customers paying down their loans subject to deferral. Note that the graphs displaying “movements” (top right on both dashboards above) only include exits, new or extended deferrals but do not include other factors that change the value of total loans subject to temporary repayment deferral. Also note that, when a borrower’s loan repayment deferral is extended it is reported in this data as both "expired or exited in the month" (as the initial deferral has expired) and "new or extended in the month" (as it has been extended). 

All data has been submitted to APRA on a best endeavours basis under relatively tight timeframes. As a result, data may be revised in future reports.

APRA will continue to publish this information on a monthly basis until loans subject to repayment deferrals are no longer a notable component of the ADI industry’s total loan portfolio.

Footnote

  1. Domestic loan portfolio refers to loans provided within Australia on the balance sheet of the licenced ADI.

Next issue

The February 2021 issue will be released on 31 March 2021.

Many authorised deposit-taking institutions (ADIs) have granted temporary relief to borrowers impacted by COVID-19, allowing them to defer loan repayments for a period of time. To provide greater transparency of loan repayment deferrals, APRA is publishing:

  • the aggregated data obtained from all ADIs in Australia, excluding foreign branches; and 
     
  • data from ADIs with loans subject to repayment deferral.

Aggregate industry data on loans subject to repayment deferral

An accessible version of this dashboard is available at https://www.apra.gov.au/temporary-loan-repayment-deferrals-due-to-covid-19-february-2021-accessible-version

* the number of facilities does not necessarily indicate the number of borrowers as individual facilities with more than one repayment type may be reported more than once.

** to give an indicator of potential elevated risk in loans subject to deferral this chart compares loans subject to deferral to total loans across three key cohorts – loan to value ratio of greater than 90 per cent, investor loans and interest only loans. 

An accessible version of this dashboard is available here.

Additional commentary

 Deferred loansTotal loansDeferred loans, share of total loans
Total$14.0 billion$2.6 trillion0.5%
Housing$11.7 billion$1.7 trillion0.7%
SME$1.5 billion$314.4 billion0.5%

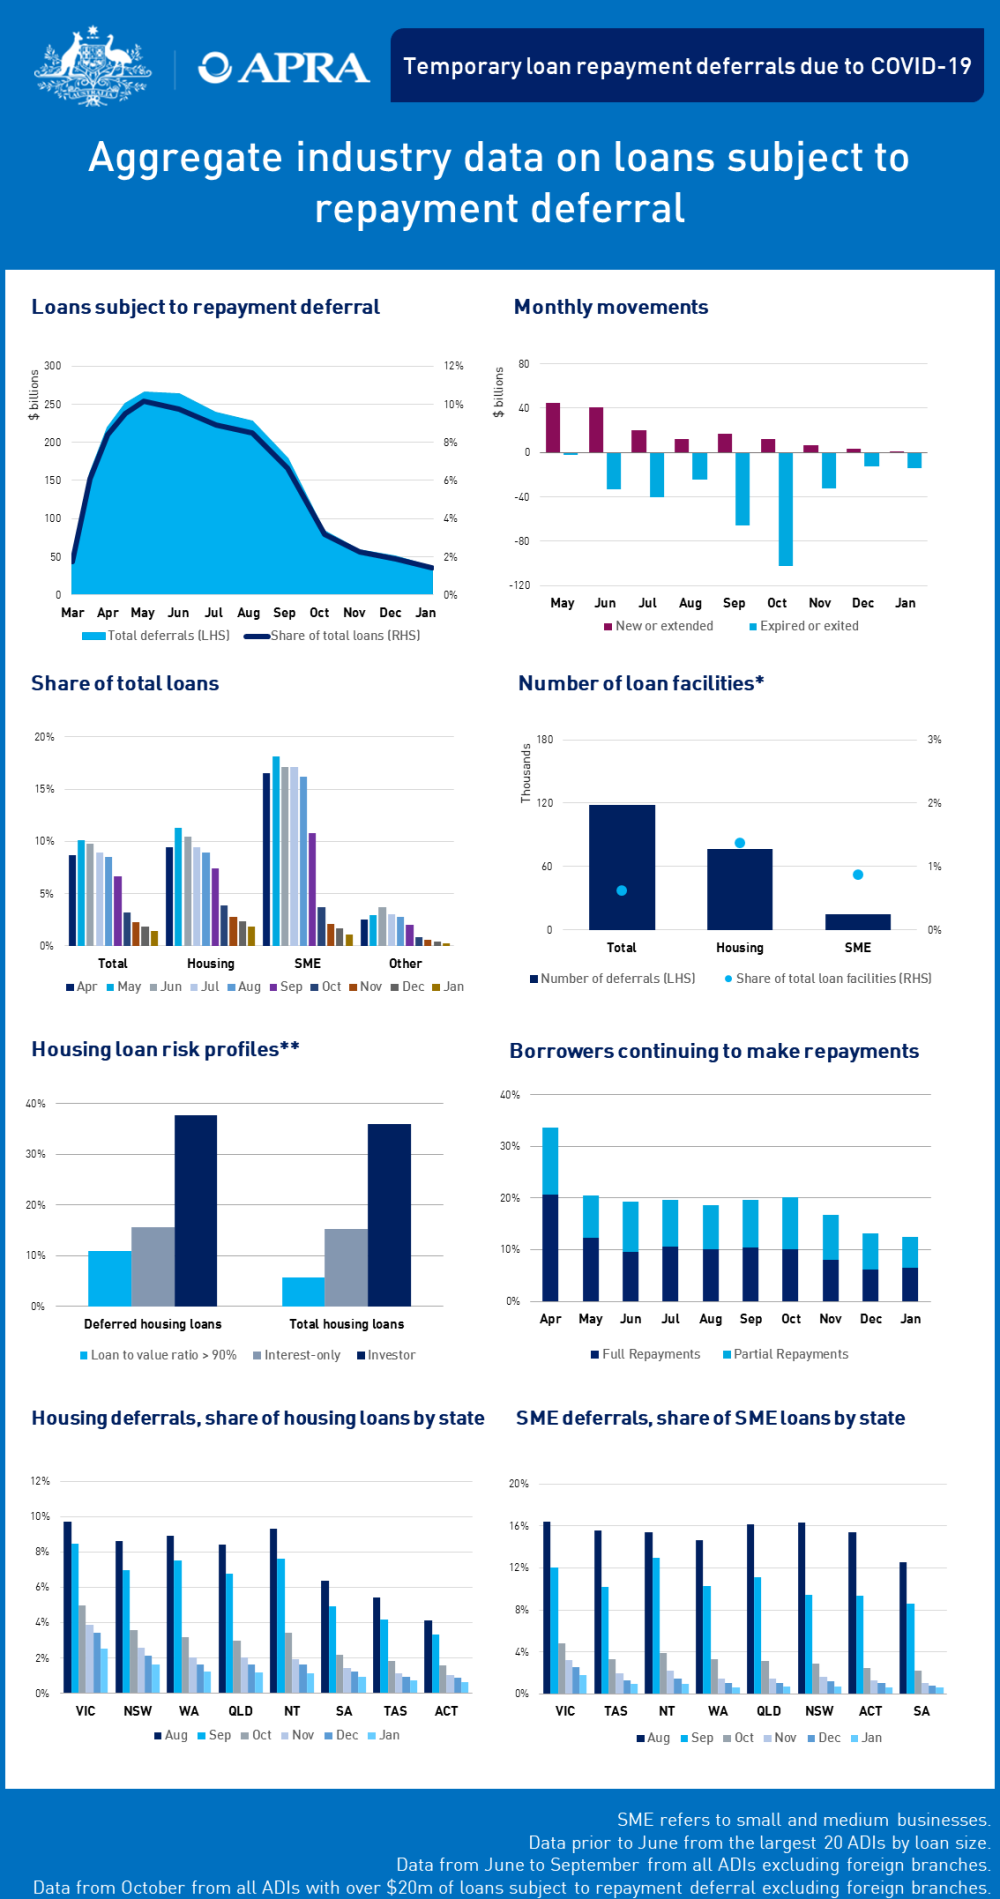
As at 28 February, according to data submitted by ADIs with over $20 million in loans subject to repayment deferral, a total of $14 billion worth of loans are on temporary repayment deferrals, which is around 0.5 per cent of total loans outstanding, down from $37 billion (1.4 per cent of total loans outstanding) in January. 

Housing loans make up the majority of total loans on repayment deferral and have a higher incidence of deferral, with 0.7 per cent of these loans subject to deferral, compared to 0.5 per cent of SME loans.

As expected, exits from deferral continue to significantly outweigh entries into deferral, with $22 billion in loans expiring or exiting deferral and less than $500 million entering or being extended. Victoria remains the state with the highest proportion of loans subject to deferral, at 0.7 per cent compared with the rest of the country at 0.4 per cent, though this difference tightened in February.  

Largest ADIs with loans subject to repayment deferral

An accessible version of this dashboard is available at https://www.apra.gov.au/temporary-loan-repayment-deferrals-due-to-covid-19-february-2021-accessible-version

An accessible version of this dashboard is available here.

Explanatory notes

This data is sourced from the domestic loan portfolios1 of APRA-regulated authorised deposit-taking institutions (ADIs), excluding foreign branches. The spreadsheet below contains data for all ADIs with total loans subject to temporary repayment deferral of greater than $20 million and more than 20 deferred facilities in any given reporting period. In addition, for privacy reasons, fields are masked where there is a non-zero value below $10 million or there are less than 20 facilities. For an entity where either the "new or extended in the month" field or the "expired or exited in the month" field falls below this threshold, both of these fields are masked.

Changes in total loans subject temporary repayment deferral occur due to several factors. These factors include (but are not limited to) new deferrals, exits from deferral, addition of interest charges on existing deferrals and customers paying down their loans subject to deferral. Note that the graphs displaying “movements” (top right on both dashboards above) only include exits, new or extended deferrals but do not include other factors that change the value of total loans subject to temporary repayment deferral. Also note that, when a borrower’s loan repayment deferral is extended it is reported in this data as both "expired or exited in the month" (as the initial deferral has expired) and "new or extended in the month" (as it has been extended). 

All data has been submitted to APRA on a best endeavours basis under relatively tight timeframes. As a result, data may be revised in future reports.

Footnote

  1. Domestic loan portfolio refers to loans provided within Australia on the balance sheet of the licenced ADI.

Next issue

As temporary loan repayment deferrals programs are coming to an end, APRA is discontinuing its statistical publication, with this February edition being the final publication of this data. Information on the ongoing performance of ADI lending, including non-performing loans, will be available in future editions of APRA’s regular quarterly statistical publications available on the APRA website at: Quarterly authorised deposit-taking institution statistics.

As announced on 19 July 2021, APRA provided a further round of temporary regulatory treatment for loans impacted by COVID-19. For eligible borrowers, ADIs do not need to treat a repayment deferral as a loan restructuring or the period of deferral as a period of arrears.

To provide greater transparency APRA is resuming publishing of aggregate and entity-level loan repayment deferrals data, in a similar manner as in 2020/21. In this ‘second round’, however, the threshold for reporting has been lifted to those ADIs with $50 million and 50 facilities in loans subject to repayment deferral, compared to $20 million and 20 facilities in the ‘first round’.

A number of ADIs have chosen to take advantage of this capital treatment and allow borrowers to defer their loan repayments for a period of time. Other ADIs have chosen to support their customers through various other means, including offering repayment deferrals without taking advantage of the concessional capital treatment. While these ADIs may not appear in the published statistics as they do not meet the threshold for reporting, this does not suggest they are not providing appropriate support for their customers. 

An accessible version of this dashboard is available at https://www.apra.gov.au/temporary-loan-repayment-deferrals-due-to-covid-19-august-2021-accessible-version

* the number of facilities does not necessarily indicate the number of borrowers as individual facilities with more than one repayment type may be reported more than once.

** to give an indicator of potential elevated risk in loans subject to deferral this chart compares loans subject to deferral to total loans across three key cohorts – loan to value ratio of greater than 90 per cent, investor loans and interest only loans. 

An accessible version of this dashboard is available here.

Additional commentary

 Deferred loansTotal loans1Deferred loans, share of total loans
Total$11.9 billion$2.2 trillion0.5%
Housing$10.8 billion$1.5 trillion0.7%
SME$765 million$252.7 billion0.3%

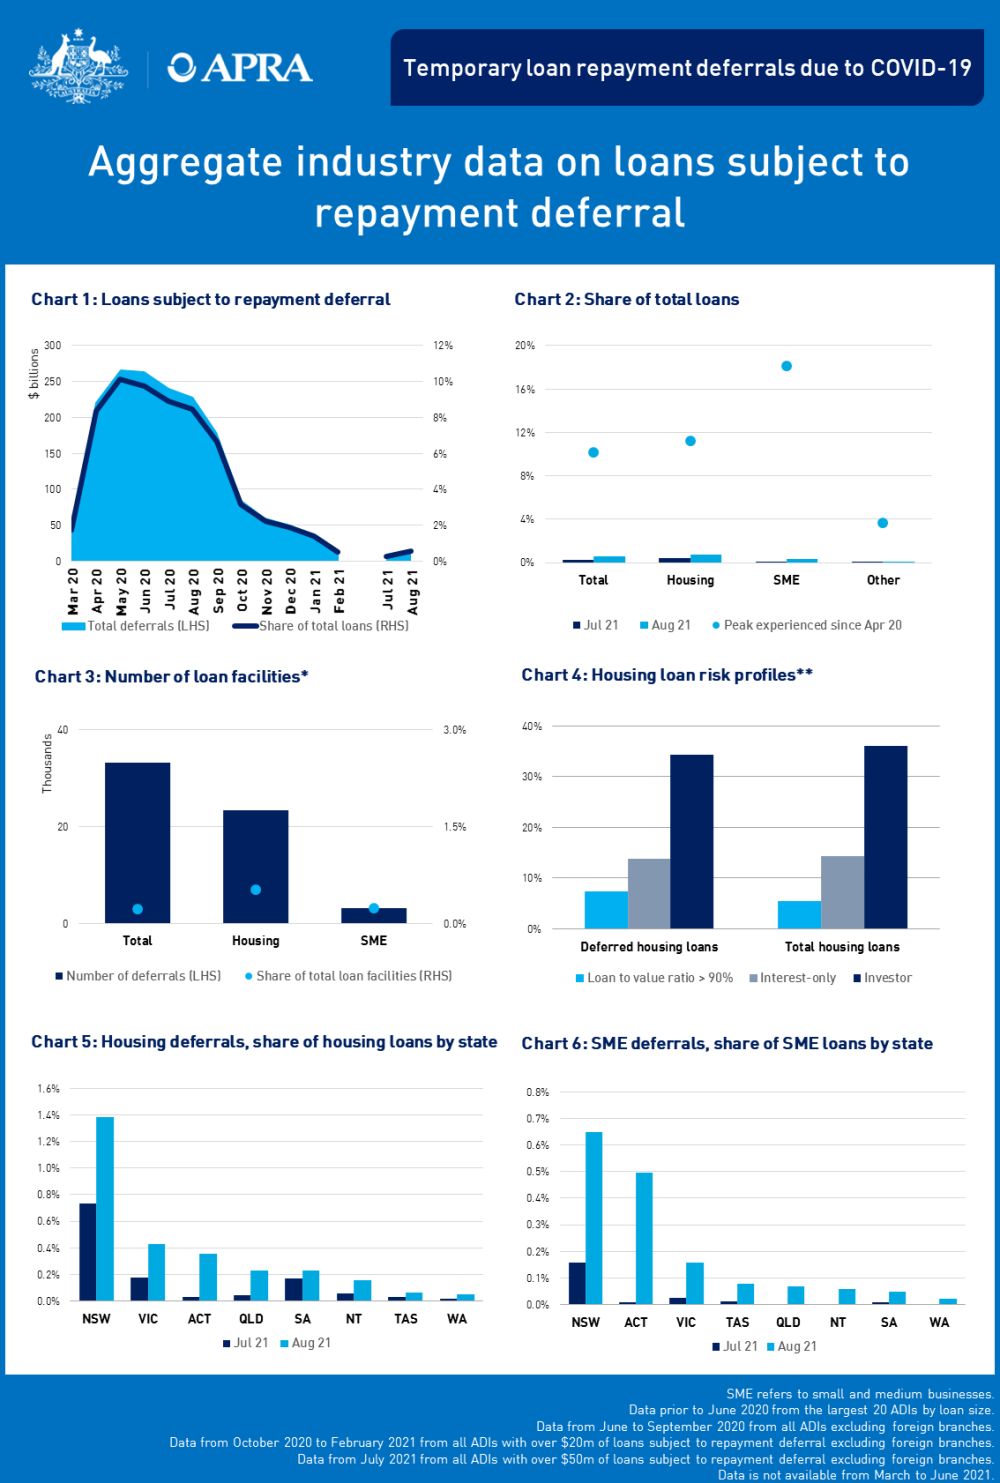
As at 31 August, according to data submitted by ADIs with over $50 million in loans subject to repayment deferral, a total of $11.9 billion worth of loans are on temporary repayment deferrals, which is around 0.5 per cent of total loans outstanding for these ADIs, up from $5.6 billion (0.3 per cent of total loans outstanding) in July. This is a significantly lower amount than at the height of the crisis in mid-2020 where repayment deferrals peaked at around 10 per cent of total lending. 

Housing loans make up the majority of total loans on repayment deferral and have a higher incidence of deferral, with 0.7 per cent of these loans subject to deferral, compared to 0.3 per cent of SME loans.

New South Wales has the highest proportion of loans subject to deferral, at 1.4 per cent compared with the rest of the country at 0.3 per cent, though this difference tightened in August.  

Explanatory notes

This data is sourced from the domestic loan portfolios2 of APRA-regulated authorised deposit-taking institutions (ADIs), excluding foreign branches. The spreadsheet below contains data for all ADIs with total loans subject to temporary repayment deferral of greater than $50 million and more than 50 deferred facilities in any given reporting period. In addition, for privacy reasons, fields are masked where there is a non-zero value below $10 million or there are less than 20 facilities. For an entity where either the "new or extended in the month" field or the "expired or exited in the month" field falls below this threshold, both of these fields are masked.

Changes in total loans subject temporary repayment deferral occur due to several factors. These factors include (but are not limited to) new deferrals, exits from deferral, addition of interest charges on existing deferrals and customers paying down their loans subject to deferral. Also note that, when a borrower’s loan repayment deferral is extended it is reported in this data as both "expired or exited in the month" (as the initial deferral has expired) and "new or extended in the month" (as it has been extended). 

All data has been submitted to APRA on a best endeavours basis under relatively tight timeframes. As a result, data may be revised in future reports.

Footnotes

  1. Of ADIs that meet the reporting threshold for loan repayment deferrals.
  2. Domestic loan portfolio refers to loans provided within Australia on the balance sheet of the licenced ADI.

Next issue

The September 2021 issue will be released on 29 October 2021. As temporary loan repayment deferrals programs are coming to an end, APRA will consider the continuation of its statistical publication after the September 2021 edition.

As announced on 19 July 2021, APRA provided a further round of temporary regulatory treatment for loans impacted by COVID-19. For eligible borrowers, ADIs do not need to treat a repayment deferral as a loan restructuring or the period of deferral as a period of arrears.

To provide greater transparency APRA is resuming publishing of aggregate and entity-level loan repayment deferrals data, in a similar manner as in 2020/21. In this ‘second round’, however, the threshold for reporting has been lifted to those ADIs with $50 million and 50 facilities in loans subject to repayment deferral, compared to $20 million and 20 facilities in the ‘first round’.

A number of ADIs have chosen to take advantage of this capital treatment and allow borrowers to defer their loan repayments for a period of time. Other ADIs have chosen to support their customers through various other means, including offering repayment deferrals without taking advantage of the concessional capital treatment. While these ADIs may not appear in the published statistics as they do not meet the threshold for reporting, this does not suggest they are not providing appropriate support for their customers. 

An accessible version of this dashboard is available at https://www.apra.gov.au/temporary-loan-repayment-deferrals-due-to-covid-19-september-2021-accessible-version

 * the number of facilities does not necessarily indicate the number of borrowers as individual facilities with more than one repayment type may be reported more than once.

** to give an indicator of potential elevated risk in loans subject to deferral this chart compares loans subject to deferral to total loans across three key cohorts – loan to value ratio of greater than 90 per cent, investor loans and interest only loans. 

An accessible version of this dashboard is available here.

Additional commentary

 Deferred loansTotal loans1Deferred loans, share of total loans
Total$13.1 billion$2.2 trillion0.6%
Housing$11.5 billion$1.5 trillion0.8%
SME$1.2 billion$253.9 billion0.5%

As at 30 September, according to data submitted by ADIs with over $50 million in loans subject to repayment deferral, a total of $13.1 billion worth of loans are on temporary repayment deferrals, which is around 0.6 per cent of total loans outstanding for these ADIs, up from $11.9 billion (0.5 per cent of total loans outstanding) in August. This remains at a significantly lower amount than at the height of the crisis in mid-2020 where repayment deferrals peaked at around 10 per cent of total lending. 

Housing loans make up the majority of total loans on repayment deferral and have a higher incidence of deferral, with 0.8 per cent of these loans subject to deferral, compared to 0.5 per cent of SME loans.

New South Wales has the highest proportion of housing loans subject to deferral, at 1.4 per cent compared with the rest of the country at 0.4 per cent, though this difference tightened in September.  

Explanatory notes

This data is sourced from the domestic loan portfolios2 of APRA-regulated authorised deposit-taking institutions (ADIs), excluding foreign branches. The spreadsheet below contains data for all ADIs with total loans subject to temporary repayment deferral of greater than $50 million and more than 50 deferred facilities in any given reporting period. In addition, for privacy reasons, fields are masked where there is a non-zero value below $10 million or there are less than 20 facilities. For an entity where either the "new or extended in the month" field or the "expired or exited in the month" field falls below this threshold, both of these fields are masked.

Changes in total loans subject temporary repayment deferral occur due to several factors. These factors include (but are not limited to) new deferrals, exits from deferral, addition of interest charges on existing deferrals and customers paying down their loans subject to deferral. Also note that, when a borrower’s loan repayment deferral is extended it is reported in this data as both "expired or exited in the month" (as the initial deferral has expired) and "new or extended in the month" (as it has been extended). 

All data has been submitted to APRA on a best endeavours basis under relatively tight timeframes. As a result, data may be revised in future reports.

Footnotes

  1. Of ADIs that meet the reporting threshold for loan repayment deferrals.
  2. Domestic loan portfolio refers to loans provided within Australia on the balance sheet of the licenced ADI.

Next issue

The October 2021 issue will be released on 30 November 2021. As temporary loan repayment deferrals programs are coming to an end, APRA may cease this publication after the October edition.

As announced on 19 July 2021, APRA provided a further round of temporary regulatory treatment for loans impacted by COVID-19. For eligible borrowers, ADIs do not need to treat a repayment deferral as a loan restructuring or the period of deferral as a period of arrears.

To provide greater transparency APRA is resuming publishing of aggregate and entity-level loan repayment deferrals data, in a similar manner as in 2020/21. In this ‘second round’, however, the threshold for reporting has been lifted to those ADIs with $50 million and 50 facilities in loans subject to repayment deferral, compared to $20 million and 20 facilities in the ‘first round’.

A number of ADIs have chosen to take advantage of this capital treatment and allow borrowers to defer their loan repayments for a period of time. Other ADIs have chosen to support their customers through various other means, including offering repayment deferrals without taking advantage of the concessional capital treatment. While these ADIs may not appear in the published statistics as they do not meet the threshold for reporting, this does not suggest they are not providing appropriate support for their customers. 

An accessible version of this graphic is available at https://www.apra.gov.au/temporary-loan-repayment-deferrals-due-to-covid-19-november-2021-accessible-version

* the number of facilities does not necessarily indicate the number of borrowers as individual facilities with more than one repayment type may be reported more than once.

** to give an indicator of potential elevated risk in loans subject to deferral this chart compares loans subject to deferral to total loans across three key cohorts – loan to value ratio of greater than 90 per cent, investor loans and interest only loans. 

An accessible version of this dashboard is available here.

Additional commentary

 Deferred loansTotal loans1Deferred loans, share of total loans
Total$8.5 billion$2.2 trillion0.4%
Housing$7.2 billion$1.5 trillion0.5%
SME$0.9 billion$254.2 billion0.4%

As at 31 October, according to data submitted by ADIs with over $50 million in loans subject to repayment deferral, a total of $8.5 billion worth of loans are on temporary repayment deferrals, which is around 0.4 per cent of total loans outstanding for these ADIs, down from $13.1 billion (0.6 per cent of total loans outstanding) in September. This remains at a significantly lower amount than at the height of the crisis in mid-2020 where repayment deferrals peaked at around 10 per cent of total lending. 

Housing loans represented the majority (85 per cent) of loans subject to repayment deferral at $7.2 billion (0.5 per cent of total housing loans) as at the end of October. Small and medium enterprise (SME) loans subject to repayment deferral were low at $926 million (0.4 per cent of total SME loans).

Across the states and territories, NSW continues to have the highest share of housing loans subject to deferral though this share fell significantly from 1.4 per cent in September to 0.6 per cent in October.

Explanatory notes

This data is sourced from the domestic loan portfolios2 of APRA-regulated authorised deposit-taking institutions (ADIs), excluding foreign branches. The spreadsheet below contains data for all ADIs with total loans subject to temporary repayment deferral of greater than $50 million and more than 50 deferred facilities in any given reporting period. In addition, for privacy reasons, fields are masked where there is a non-zero value below $10 million or there are less than 20 facilities. For an entity where either the "new or extended in the month" field or the "expired or exited in the month" field falls below this threshold, both of these fields are masked.

Changes in total loans subject temporary repayment deferral occur due to several factors. These factors include (but are not limited to) new deferrals, exits from deferral, addition of interest charges on existing deferrals and customers paying down their loans subject to deferral. Also note that, when a borrower’s loan repayment deferral is extended it is reported in this data as both "expired or exited in the month" (as the initial deferral has expired) and "new or extended in the month" (as it has been extended). 

All data has been submitted to APRA on a best endeavours basis under relatively tight timeframes. As a result, data may be revised in future reports.

Footnotes

  1. Of ADIs that meet the reporting threshold for loan repayment deferrals.
  2. Domestic loan portfolio refers to loans provided within Australia on the balance sheet of the licenced ADI. 

Next issue

The concessional treatment for new loans subject to repayment deferral ended on 30 September 2021. APRA is therefore discontinuing this statistical publication, with this October edition being the final publication of this data. Information on the ongoing performance of ADI lending, including non-performing loans, will be available in future editions of APRA’s regular quarterly statistical publications available on the APRA website at: Quarterly authorised deposit-taking institution statistics.

Many authorised deposit-taking institutions (ADIs) have granted temporary relief to borrowers impacted by COVID-19, allowing them to defer loan repayments for a period of time. To provide greater transparency of loan repayment deferrals at the industry level, APRA is publishing the data obtained from ADIs. 

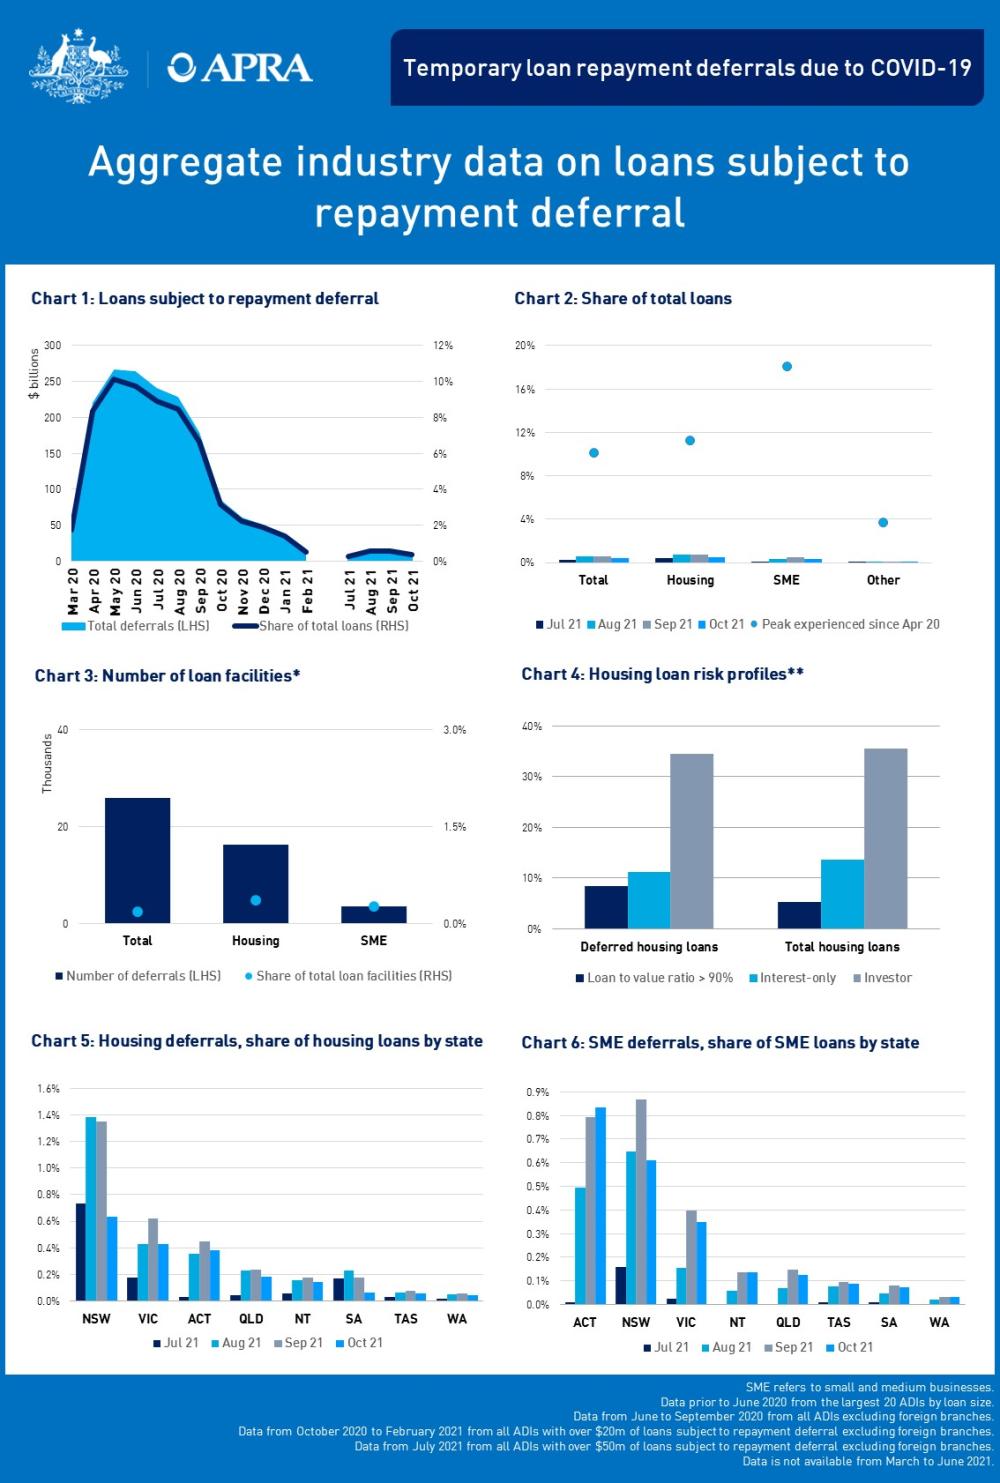
Chart 1 presents the value of loans subject to repayment deferral and its share of total loans, from March 2020 to October 2021. Note that data was not collected from March to June 2021. 

Progressive total of loans subject to deferral: $8.5 billion of loans were subject to deferral at 31 October 2021, representing 0.4% of total loans.

Chart 2 presents the proportion of loans subject to repayment deferral across four categories - total, housing, SME and other, for July and October 2021. It also shows the respective peaks experienced since the April 2020 reporting period.

Proportion of total loans: At 31 July 2021: Total loan deferrals – 0.3% of total loans, Housing loan deferrals – 0.4% of housing loans, SME loan deferrals – 0.1% of SME loans. At 31 August 2021: Total loan deferrals – 0.5% of total loans, Housing loan deferrals – 0.7% of housing loans, SME loan deferrals – 0.3% of SME loans. At 30 September 2021: Total loan deferrals – 0.6% of total loans, Housing loan deferrals – 0.8% of housing loans, SME loan deferrals – 0.5% of SME loans. At 31 October 2021: Total loan deferrals – 0.4% of total loans, Housing loan deferrals – 0.5% of housing loans, SME loan deferrals – 0.4% of SME loans. Peaks experienced since 30 April 2020: Total loan deferrals – 10.1% of total loans, Housing loan deferrals – 11.3% of housing loans, SME loan deferrals – 18.1% of SME loans.

Chart 3 presents the number of deferred loan facilities and its share of total loan facilities as at 31 October 2021.  

Number of loan facilities*: Total – 25,825 (0.2% of total facilities); Housing – 16,217 (0.4% of housing facilities); SME – 3,445 (0.3% of SME facilities).

*The number of facilities does not necessarily indicate the number of borrowers as individual facilities with more than one repayment type may be reported more than once.

Chart 4 presents loans subject to deferral to total loans across three key cohorts - loan to value ratio of greater than 90 per cent, investor loans and interest only loans, as at 31 October 2021. 

Housing loan risk profiles**

Deferred housing loans (percentage of housing loans)

  • Loan to value ratio > 90 – 8%
  • Interest-only – 11%
  • Investor – 34%

Total housing loans (percentage of total loans)

  • Loan to value ratio > 90% – 5%
  • Interest-only – 14%
  • Investor – 36%

**to give an indicator of potential elevated risk in loans subject to deferral this chart compares loans subject to deferral to total loans across three key cohorts - loan to value ratio of greater than 90 per cent, investor loans and interest only loans. 

Chart 5 presents the proportion of housing loans that are subject to temporary repayment deferral by state and territory, from July to October 2021.

Housing loan deferrals, share of housing loans: At 31 July 2021: NSW – 0.73%, VIC – 0.18%, ACT – 0.03%, QLD – 0.04%, SA – 0.17%, NT – 0.06%, TAS – 0.03%, WA – 0.02%. At 31 August 2021: NSW – 1.39%, VIC – 0.43%, ACT – 0.36%, QLD – 0.23%, SA – 0.23%, NT – 0.15%, TAS – 0.06%, WA – 0.05%. At 30 September 2021: NSW – 1.35%, VIC – 0.62%, ACT – 0.45%, QLD – 0.24%, SA – 0.18%, NT – 0.18%, TAS – 0.08%, WA – 0.06%. At 31 October 2021: NSW – 0.63%, VIC – 0.43%, ACT – 0.38%, QLD – 0.18%, NT – 0.14%, SA – 0.06%, TAS – 0.06%, WA – 0.04%.

Chart 6 presents the proportion of SME loans that are subject to temporary repayment deferral by state and territory, from July to October 2021.

SME loan deferrals, share of SME loans: At 31 July 2021: NSW – 0.16%, ACT– 0.01%, VIC – 0.02%, TAS – 0.01%, QLD – 0%, NT – 0%, SA – 0.01%, WA – 0%. At 31 August 2021: NSW – 0.65%, ACT– 0.50%, VIC – 0.16%, TAS – 0.08%, QLD – 0.07%, NT – 0.06%, SA – 0.05%, WA – 0.02%. At 30 September 2021: NSW – 0.87%, ACT– 0.79%, VIC – 0.40%, QLD – 0.15%, NT – 0.13%, TAS – 0.10%, SA – 0.08%, WA – 0.03%. At 31 October 2021: ACT– 0.83%, NSW – 0.61%, VIC – 0.35%, NT – 0.14%, QLD – 0.12%, TAS – 0.09%, SA – 0.07%, WA – 0.03%.

Data as at 31 October 2021. Data prior to June 2020 from the largest 20 ADIs by loan size. Data from June to September 2020 from all ADIs excluding foreign branches. Data from October 2020 to February 2021 from all ADIs with over $20m of loans subject to repayment deferral excluding foreign branches. Data from July 2021 from all ADIs with over $50m of loans subject to repayment deferral excluding foreign branches. Data is not available from March to June 2021.

Footnotes

    For more information

    Email dataanalytics@apra.gov.au or mail to

    Manager, External Data Reporting
    Australian Prudential Regulation Authority
    GPO Box 9836, Sydney NSW 2001

    Looking for discontinued publications?

    Search historical snapshots of APRA's website on the Australian Government web archive.