Product Coverage
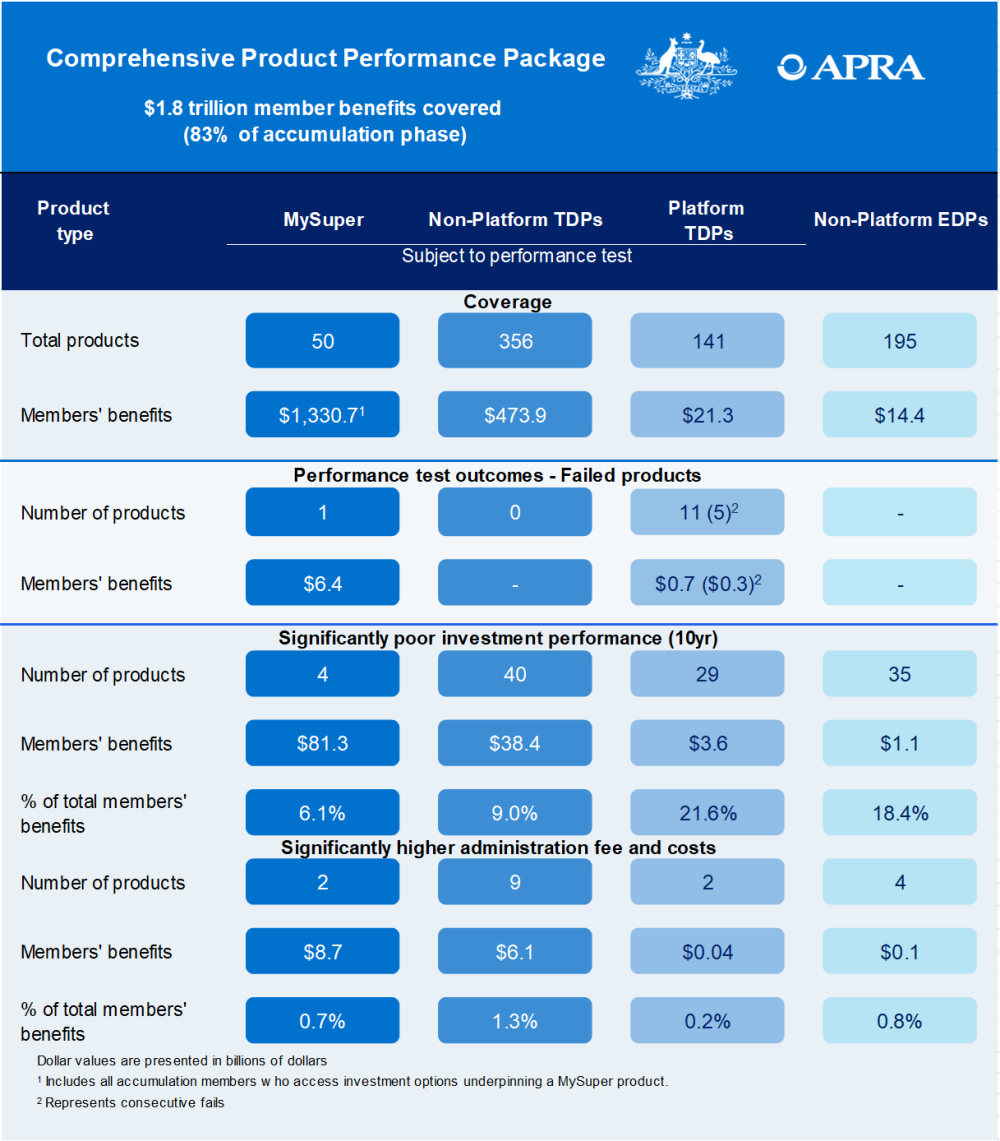
The CPPP covers accumulation multi-sector products offered by APRA-regulated funds and assesses these products using both the outcomes of the PT and additional performance measures focused on investments, and fees and costs. The CPPP does not currently cover any retirement products, single sector products, platform EDPs or defined benefit products.
Collectively, the products covered in the CPPP capture 83 per cent of accumulation member benefits (around $1.8 trillion of the $2.2 trillion held in accumulation products). The CPPP aims to highlight underperformance in key areas to ensure that members receive high-quality outcomes for their retirement.
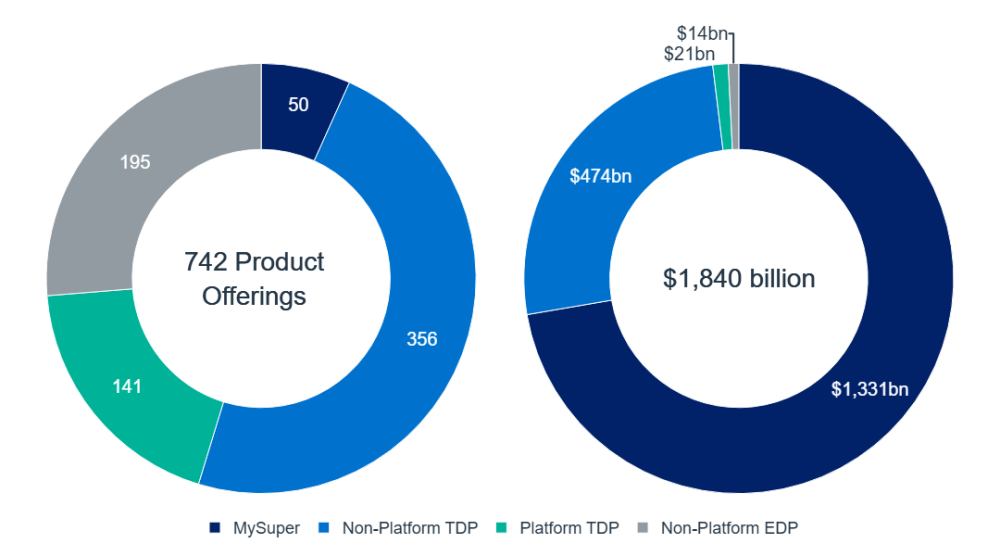
In 2026, 742 product offerings are covered: 50 MySuper products, 141 platform TDPs, 356 non-platform TDPs and 195 non-platform EDPs. These products represent over $1.8 trillion in member retirement savings. While MySuper products only represent a small number of overall product offerings (6.7 per cent) they hold more than $1.3 trillion in member retirement savings (Figure 1).
Figure 1: 2026 CPPP product type breakdown
2. Performance Test
What is the Performance Test?
The PT is designed to protect Australians’ retirement savings from underperforming products by holding trustees accountable for the outcomes they deliver through increased transparency and significant consequences for continued underperformance. The PT has been in place since 2021 as prescribed in the Superannuation Industry (Supervision) Regulations 1994, with APRA responsible for administering the test.
The PT comprises two components:
- an investment performance component measures the implementation of an investment product’s strategy by comparing the returns of the product to a benchmark derived from the product’s Strategic Asset Allocation (SAA); and
- a fees and costs component measures how the administration fees and costs of a product compares to peer products through a comparison fee benchmark. This benchmark is termed the Benchmark Representative Administration Fees and Expenses (BRAFE) and is the median fee and cost value for the relevant product type.
A product fails the PT if its assessment value (the combination of the two components) is below a threshold of minus 0.50 percentage points per annum.
The PT has several legislated consequences for failure. Members in a product that fails the PT must be informed of this fact in writing, while products that fail the test for two consecutive years must be closed to new members.
In 2026, Treasury conducted a consultation on potential enhancements to the PT, including changes to benchmarks, risk-adjusted returns and product coverage.
Performance Test fails
The number of products failing the PT increased slightly in 2026, but remains within the range observed over the last three years.
Across the 547 product offerings tested in 2026, 12 failed the PT in 2026 compared to 7 that failed in 2025. Of the 12 failures (11 Platform TDPs and 1 MySuper product), 5 Platform TDPs failed for at least two consecutive years. These products with consecutive fails can no longer be offered to new members.
Six trustees are responsible for this year’s 12 failed products (including one MySuper):
- BUSS (Queensland) Pty Ltd had 1 failed product (their MySuper product)
- Bendigo Superannuation Pty Ltd had 2 failed products (both consecutive failed products)
- I.O.O.F. Investment Management Limited had 2 failed products
- N.M. Superannuation Proprietary Limited had 3 failed products (all consecutive failed products)
- Oasis Fund Management Limited had 2 failed products
- OnePath Custodians Pty Limited had 2 failed products
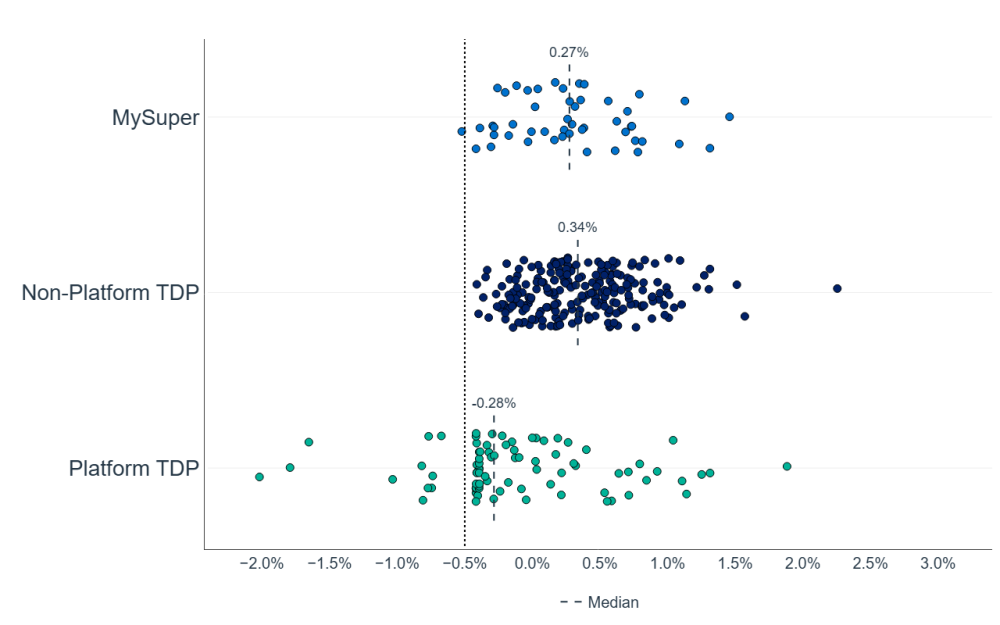
Figure 2: Performance Test Metric distribution
APRA notes:
- APRA administers the Performance Test in line with the SIS Act and SIS Regulations. Notably, the Performance Test compares TDPs to other TDPs to establish the BRAFE. This is material because if, for example, TDPs were compared to TDPs and also EDPs this would have implications on the BRAFE and Performance Test results. The scope of the Performance Test is currently under consideration by Government.
- A small number of TDPs passed the performance test in part due to trustees continuing to apply rebates to members. While this does benefit members, APRA’s expectation is that any such rebates to members should be enduring, including so that trustees may satisfy themselves as part of the annual outcomes assessment under the SIS Act that they are effectively promoting the financial interests of members.
- Some underperforming products per the CPPP methodology may have tax benefits, capital guarantees or other features that may offer value to some members.
Observations relating to the individual PT components
Underperformance in investment strategy implementation continues to be the main reason for products failing
Consistent with previous years, the investment component of the PT was the primary driver of fails. For all 12 failed products (100 per cent) the investment component was less than the PT threshold of minus 50 basis points per annum.
Median investment performance relative to benchmark across the products in the 2026 PT has:
- remained positive for MySuper products at 0.27 per cent per annum;
- remained positive for non-platform TDPs at 0.34 per cent per annum; and
- remained negative for platform TDPs at minus 0.19 per cent per annum.
When looking at the fees and costs component of the PT, of the products that failed, 5 products failed due to a combination of high administration fees and costs and relatively poor investment strategy implementation.
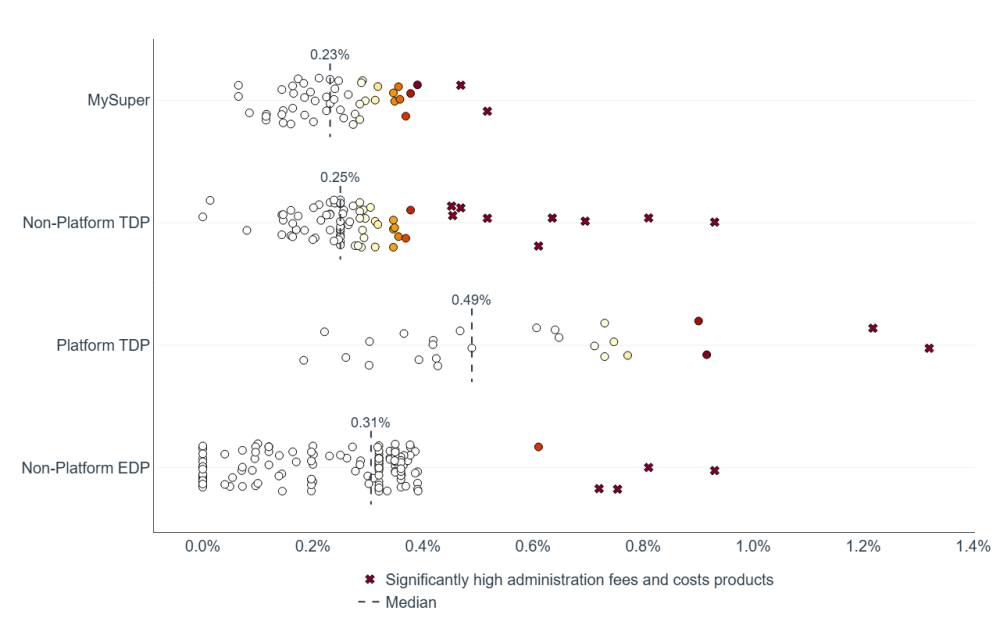
The median administration fees and costs (as measured by the BRAFE) remained relatively stable across all product types over the year to 2026. Movements in the BRAFE over the year:
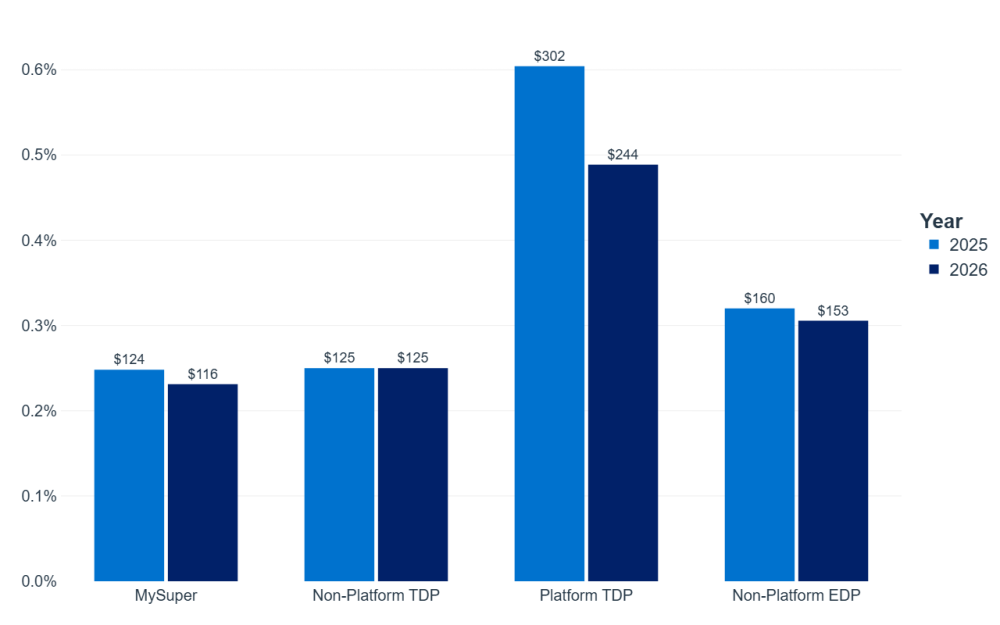
- Decreased 1.69 basis points for MySuper products to 0.2313%;
- Increased 0.85 basis points for non-platform TDPs to 0.2530%; and
- No change for platform TDPs at 0.4675%.
Trustees need to strike an appropriate balance between maintaining competitive fees and investing in the capabilities, systems and processes required to effectively manage current and emerging risks.
3. Additional Performance Measures
How the APRA CPPP assesses investment performance
When considering performance in the context of investment returns for the CPPP, APRA assesses broader aspects of investment management through comparing returns to:
- a Simple Reference Portfolio (SRP), to measure the value-add of asset class decisions against a simple, low-cost portfolio; and
- Returns relative to peers (based on underlying growth asset allocations), to compare the performance of products to similar products on a risk-adjusted basis.
To get a broader view of a product’s investment performance, APRA assesses products in this paper using the CPPP metric, which is a combination of the metrics outlined above and the investment component of the PT over a 10-year time horizon.
To help track changes in the performance of products over time and through different market environments, these additional metrics are provided over the time horizons of 3, 5, 7 and 10 years.
Significant underperformance and comparison to 2025
Platform TDPs and non-platform EDPs continue to have the highest proportion of products underperforming the CPPP metric.
The proportion of products underperforming the CPPP metric increased marginally from 41.0 per cent to 41.4 per cent in 2026 for platform TDPs. Underperformance also increased among MySuper products, rising from 2.1 per cent to 8.7 per cent.
Table 1: Comparison of the CPPP metric from 2025 to 2026 across product types
Underperforming the 10-year CPPP metric by 50bps or more| Product | Members’ benefits assessed | Percentage of products | Percentage of member assets |
|---|
| 2026 | 2025 | 2026 | 2025 |
|---|
| MySuper | $1,330.7 bn | 8.7% | 2.1% | 6.1% | 0.05% |
| Non-platform TDP | $473.9 bn | 20.3% | 21.0% | 9.0% | 7.0% |
| Platform TDP | $21.3 bn | 41.4% | 41.0% | 21.6% | 29.0% |
| Non-platform EDP | $14.4 bn | 29.7% | 35.3% | 18.4% | 18.1% |
Figure 3: Concentration of poor investment performance in trustees using the 2026 CPPP metric
There are higher levels of underperformance compared to the Performance Test when looking at a broad set of investment performance measures
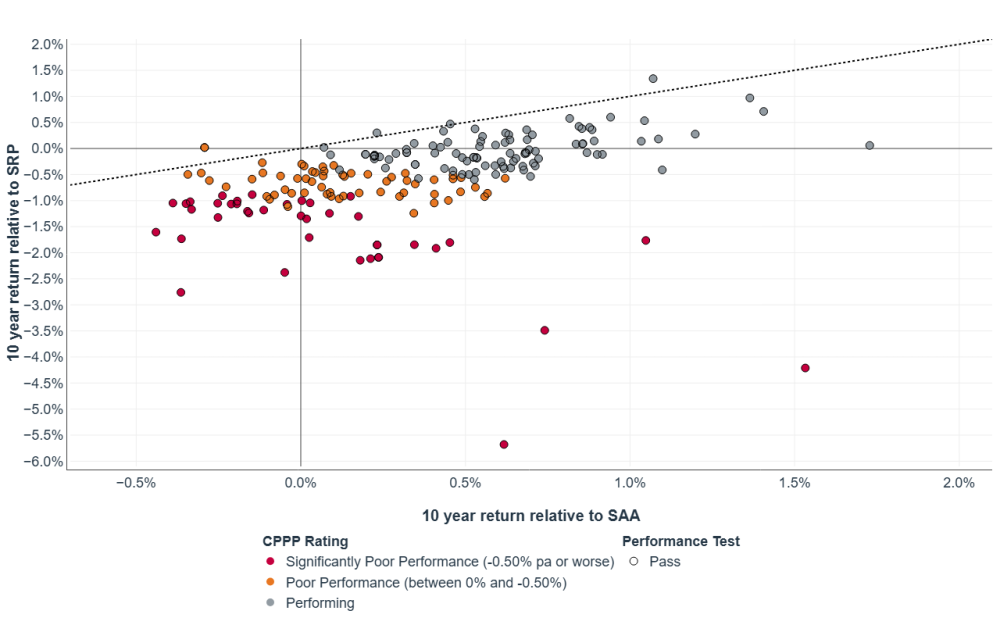
A broader range of underperforming products have been identified using the set of investment performance measures in addition to the PT investment component, with 63 additional products (MySuper, non-platform TDP and platform TDP) determined to be significantly underperforming.
In simple terms, for many products, trustees’ asset allocation decisions are not delivering outperformance relative to a simple reference portfolio.
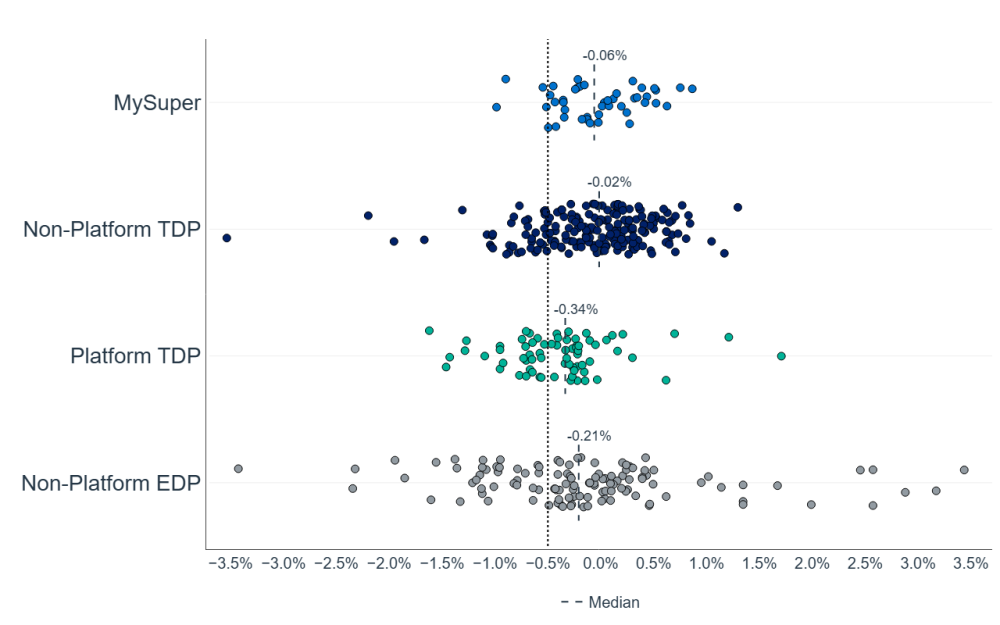
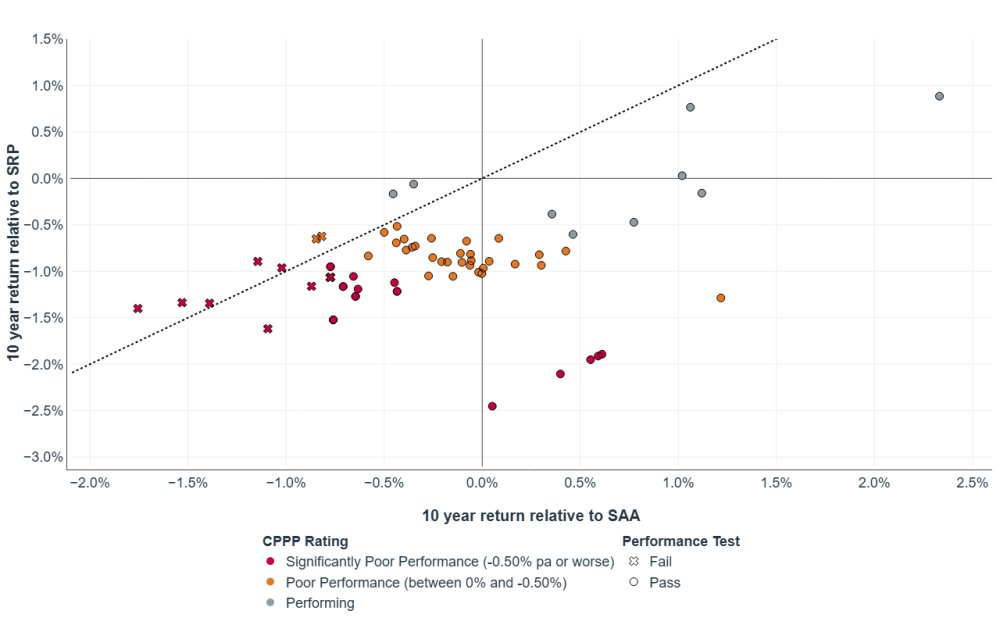
As outlined in Figures 4 and 5 by products below the dotted line, 95 per cent of TDPs are performing poorer against an SRP compared to the SAA benchmark (investment component of the PT). This trend is broadly consistent with last year where 93 per cent of TDPs performed poorer against the SRP.
Figure 4: 10-year non-platform TDP return to SRP and PT investment component
Figure 5: 10-year platform TDP return to SRP and PT investment component
How the APRA CPPP assesses fees and costs
Fees and costs are measured at different member balances of $10,000, $25,000, $50,000, $100,000 and $250,000 in the CPPP for:
- total fees and costs; and
- administration fees and costs.
Analysis on fees and costs is based on a $50,000 member account balance and presented at the product level for all products except platform TDPs which is presented at the product and menu level as this is how fees and costs are differentiated across these products.
“Significantly high fees and costs products” are defined as products who have significantly high fees and costs across 3 or more account balances compared to peers.
Overview and comparison to 2025
Administration fees and costs continued to decline across most product types in 2026.
Over the past year, administration fees and costs declined across MySuper products, platform TDPs and non-platform EDPs (Figure 6). These reductions continue the downward trend observed in recent years across most product types.
Note: administration fees and costs does not include fees for member-initiated activities, such as personal financial advice.
Figure 6: Median administration fees and costs for a $50,000 account balance
Observations across product types
The flexibility and choice provided through superannuation platforms come at a cost, with (generally) poorer investment performance and higher administration fees.
MySuper products and non-platform TDPs continue to have very similar fees and costs as expected as they often share the same services, features and fee structures. These products maintain significantly lower fees and costs than non-platform EDPs and platform TDPs. Non-platform EDPs are generally more expensive than their TDP counterparts, remaining at similar levels as last year and further reductions are required to make them on par.
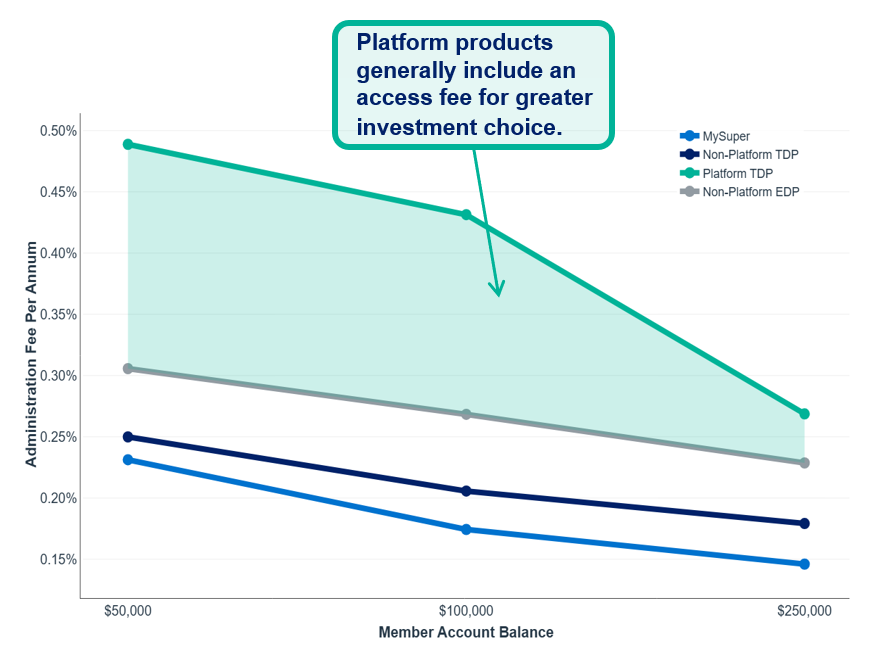
When investing through platforms, members are charged higher fees and costs which is generally due to a flat dollar fee to gain access to a wide variety of bespoke offerings (an access fee). This results in platform TDP administration fees and costs reducing (as a percentage) as member balances increase. As such, members with lower account balances will incur larger fees and costs (as a percentage) investing in platform TDPs than in other product types (Figure 7). Trustees should consider the impact of these fees on members with lower account balances, particularly where there are no minimum balance requirements. While administration fees and costs have reduced in 2026, platform TDPs remain significantly more expensive due to the flexibility they provide.
In accordance with product design and distribution obligations in Part 7.8A of the Corporations Act 2001 and ASIC Regulatory Guide 274, trustees are expected to target members with appropriate balances and investment needs to take advantage of the flexibility and services these products offer.
Figure 7: Median administration fees and costs across member balances
Significantly high administration fee and costs products
The number of products with significantly high administration fees and costs remains stable
The number of products with significantly high fees and costs in 2026 increased from 16 in 2025 to 17, with 13 (76 per cent) offered by funds with less than $10 billion in assets. Diversa Trustees Limited (4) and Equity Trustees Superannuation Limited (7) account for most high fees and costs products from funds with less than $10 billion in assets. Trustees that are unable to offer competitive fees and costs should consider how they are promoting members’ financial interests and whether these funds should continue to operate independently in the superannuation industry.
Figure 8: Administration fees and costs charged at $50,000 account balance
Important information
This document should be read in conjunction with the other documents comprising the 2026 CPPP. Attention should be given to the ‘APRA Performance Test Disclaimer’ set out in the statistical publication and other important notices contained in the document.
The information contained in this document is general in nature and does not take into account the particular investment objectives or financial situation of any person. It does not constitute, and should not be relied on as, financial or investment advice or recommendations (express or implied) and is not an invitation to buy or sell any Listed Shares, Insurance, Superannuation, Investment and or financial product or service. No decision should be made on the basis of this document without first seeking expert financial advice. Any predictions or views contained in this presentation are those of the Australian Prudential Regulation Authority (APRA) (ABN 79 635 582 658). APRA does not represent or guarantee that the information is accurate or free from errors or omissions and APRA disclaims any duty of care in relation to the information and liability for any loss resulting from reliance on the information in making investment decisions.
Copyright © Australian Prudential Regulation Authority (APRA) 2026.