Life insurance claims and disputes statistics
Industry Highlights
This publication presents the key industry-level claims and dispute outcomes for 17 Australian life insurers writing direct business (i.e., excluding reinsurance).
Chart 1: Admittance rates1by channels, for year ended June 2018 to December 2023
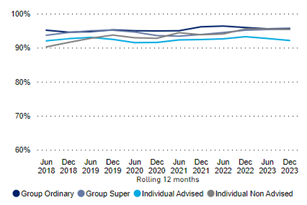
The admittance rates across all distribution channels have remained relatively stable over time.
Chart 2: Admittance rates by cover types, for year ended June 2018 to December 2023
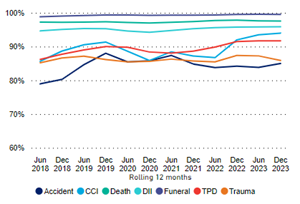
The admittance rates vary by cover types but have remained relatively stable over time.
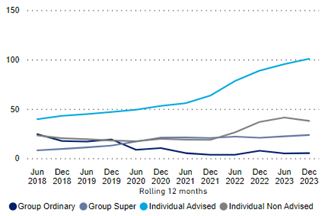
Chart 3: Claims paid ratio2by channels, for year ended June 2018 to December 2023
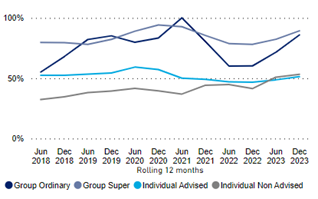
The claims paid ratios for Group products are picking up in the recent periods. In contract, ratios for Individual products have remained relatively stable.
APRA urges caution in using the claims paid ratio as a measure of consumer value or product profitability. For insurers, claims payments are only one part of the costs associated with an insurance policy. Other costs, such as administration, acquisition costs and claims reserves, are not included. Whether, and how profitable, the product is to the insurer will also depend on these factors.
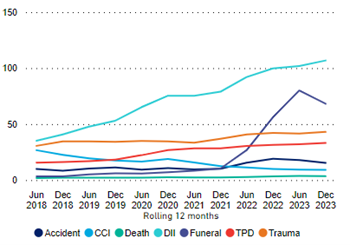
Chart 4: Claims paid ratios by cover types, for year ended June 2018 to December 2023
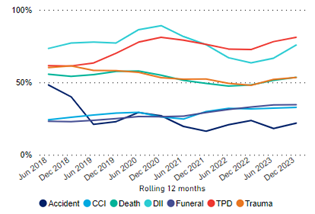
TPD and DII3covers have higher claims paid ratios. In contrast, the ratios for Accident, CCI and Funeral have remained at a lower level.
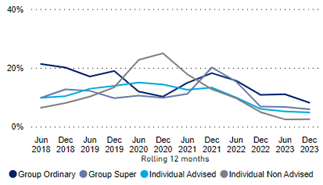
Chart 5: Dispute lodgement ratios by channels4 for year ended June 2018 to December 2023
For individual advised products, there was a sharp increase in the dispute lodgement ratios since June 2021.
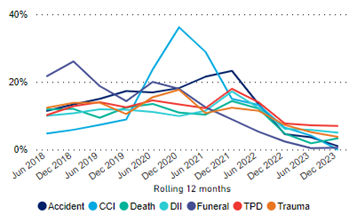
Chart 6: Dispute lodgement ratios by cover types, for year ended June 2018 to December 2023
The dispute lodgement ratios for DII and Funeral have increased considerably over time, due to recent regulatory focus.
Chart 7: Original decision reversed5 by channels, for year ended June 2018 to December 2023
The original decision reversed rates across all distribution channels have been trending downwards since December 2021.
Chart 8: Original decision reversed by cover types, for year ended June 2018 to December 2023
The original decision reversed rates across all cover types have been trending downwards since December 2021.
Footnotes
1Admittance rate is defined as the number of admitted claims as a percentage of the number of finalised claims in the same period.
2The claims paid ratio is the dollar amount of claims paid out in the reporting period as a percentage of the annual premium receivable in the same period.
3DII has recurring monthly payments. For the purposes of the reported claims ratio, total payments are approximated using an assumed 24-month payout period.
4The dispute lodgement ratio is defined as the number of disputes lodged per 100,000 lives insured.
5Original decision reversed rate is defined as the number of disputes with original decision reversed as a percentage of the number of disputes lodged in the same period.